

Are you truly winning the revenue game, or are you just staying busy while leaving money on the table? If you’ve ever stared at a fully booked hotel and wondered if you could have charged more,or looked at empty rooms and realized your rates were too high, you aren’t alone. For small boutique hotel owners, shifting to automated hotel pricing isn’t just a luxury—it’s a survival tactic. But how do you know if your strategy is actually working? By tracking the right hotel dynamic pricing success metrics, you can turn gut feelings into a data-driven powerhouse, often seeing a 15–25% increase in RevPAR within just a few months.
What is Hotel Dynamic Pricing?

Before we dive into the data, let’s define the engine. hotel dynamic pricing is the process of adjusting room rates in real-time based on local demand, competitor pricing, occupancy levels, and external market factors. Instead of a “set it and forget it” seasonal rate, this strategy ensures your price is always optimized for that specific moment.
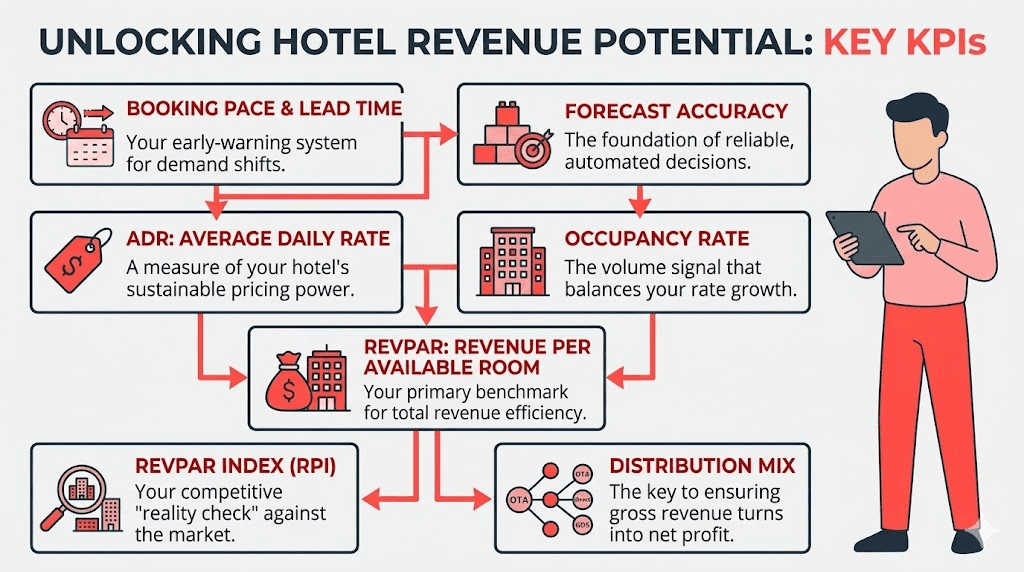
To help you measure pricing performance like a pro, here are the seven hotel pricing KPIs that every successful manager should track
- RevPAR: Your primary benchmark for total revenue efficiency.
- ADR: A measure of your hotel’s sustainable pricing power.
- Occupancy Rate: The volume signal that balances your rate growth.
- RevPAR Index (RPI): Your competitive “reality check” against the market.
- Booking Pace & Lead Time: Your early-warning system for demand shifts.
- Forecast Accuracy: The foundation of reliable, automated decisions.
- Distribution Mix: The key to ensuring gross revenue turns into net profit.
1. RevPAR: The Core Outcome of Success
Revenue per Available Room (RevPAR) is the “North Star” of hotel dynamic pricing success metrics. It’s the most trusted KPI because it doesn’t let you hide behind a high rate with no guests, or a full house with low rates. It captures the synergy between price and volume.
When using intelligent solutions like PriceLabs, hotels typically see RevPAR uplifts of 15–25% as the system balances these two levers automatically.
How to Calculate RevPAR
| Calculation Method | Formula | Example (100 rooms, $120 avg rate, 80% occupancy) |
| RevPAR (Total) | Total Room Revenue / Rooms Available | $9,600 / 100 = $96 |
| RevPAR (Components) | ADR × Occupancy Rate | $120 × 0.80 = $96 |
How to track this in PriceLabs:
Navigate to Portfolio Analytics > KPIs & Historic Reports. Here, PriceLabs provides easy-to-read charts that display your RevPAR trends over time, allowing you to see exactly how your dynamic strategy is impacting your bottom line without manual math.
2. ADR: Measuring Sustainable Pricing Power
Average Daily Rate (ADR) measures the average price paid per occupied room. While RevPAR tells you the overall health, ADR tells you about your pricing power. Are you able to command a premium because of your boutique experience, or are you just discounting to fill beds?
Dynamic pricing users often report ADR increases of 8–15% within the first year. Tracking this metric by segment (e.g., corporate vs. leisure) helps you identify which guests are willing to pay for value during peak dates.
Practical Tip: If your ADR is rising while your RevPAR is flat or falling, you might be overpricing. Successful hotel dynamic pricing success metrics show both moving upward in tandem.
How to navigate this in PriceLabs:

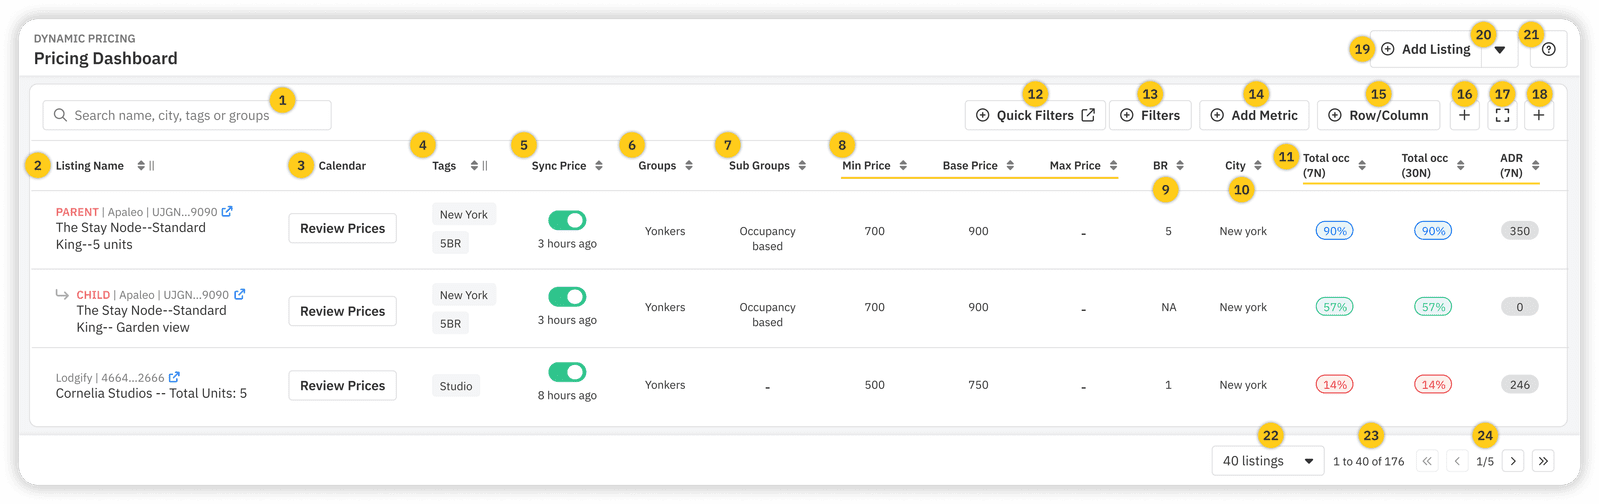
Use the PriceLabs Multi-Calendar or Pricing Dashboard to view your ADR at a glance. You can also use the Preview Prices Graph to see how adjusting your “Base Price” or “Smart Presets” will impact your projected ADR before you even hit save.
3. Occupancy Rate: Balancing Volume and Pricing
Occupancy is your real-time market signal. In a dynamic pricing environment, the goal isn’t necessarily 100% occupancy every night—it’s optimized occupancy. Dynamic pricing can improve occupancy by 10–15% by strategically lowering rates during “lean” periods and raising them when demand spikes.
How PriceLabs helps you manage occupancy

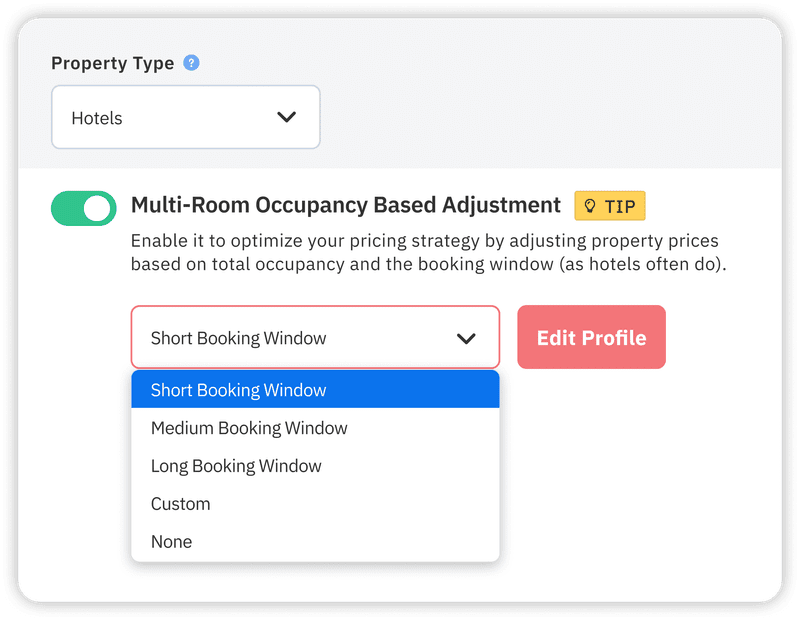
PriceLabs uses Occupancy-Based Adjustments to automatically apply discounts or premiums based on how full your hotel is for specific dates.
For Hotels: We recommend Multi-Room Occupancy-Based Adjustments (MROBA). This allows you to optimize pricing based on the combined occupancy of similar room types (like “Deluxe Kings”) rather than treating every single room as an island.
4. RevPAR Index (RPI) & MPI: Competitive Benchmarking
You don’t operate in a vacuum. If your revenue is up 10% but the market is up 20%, you’re actually falling behind. This is where dynamic pricing benchmarks come in.
- MPI (Market Penetration Index): Are you getting your fair share of guests?
- RPI (RevPAR Index): Are you getting your fair share of the money?
An RPI score above 100 means you are outperforming your competitors.
Step-by-Step Benchmarking
- Select your Comp Set: Identify 10–20 local hotels that guests consider alongside yours.
- Gather Data: Use automated tools to pull their daily rates.
- Compare: (Your RevPAR / Market RevPAR) × 100.
Navigating PriceLabs

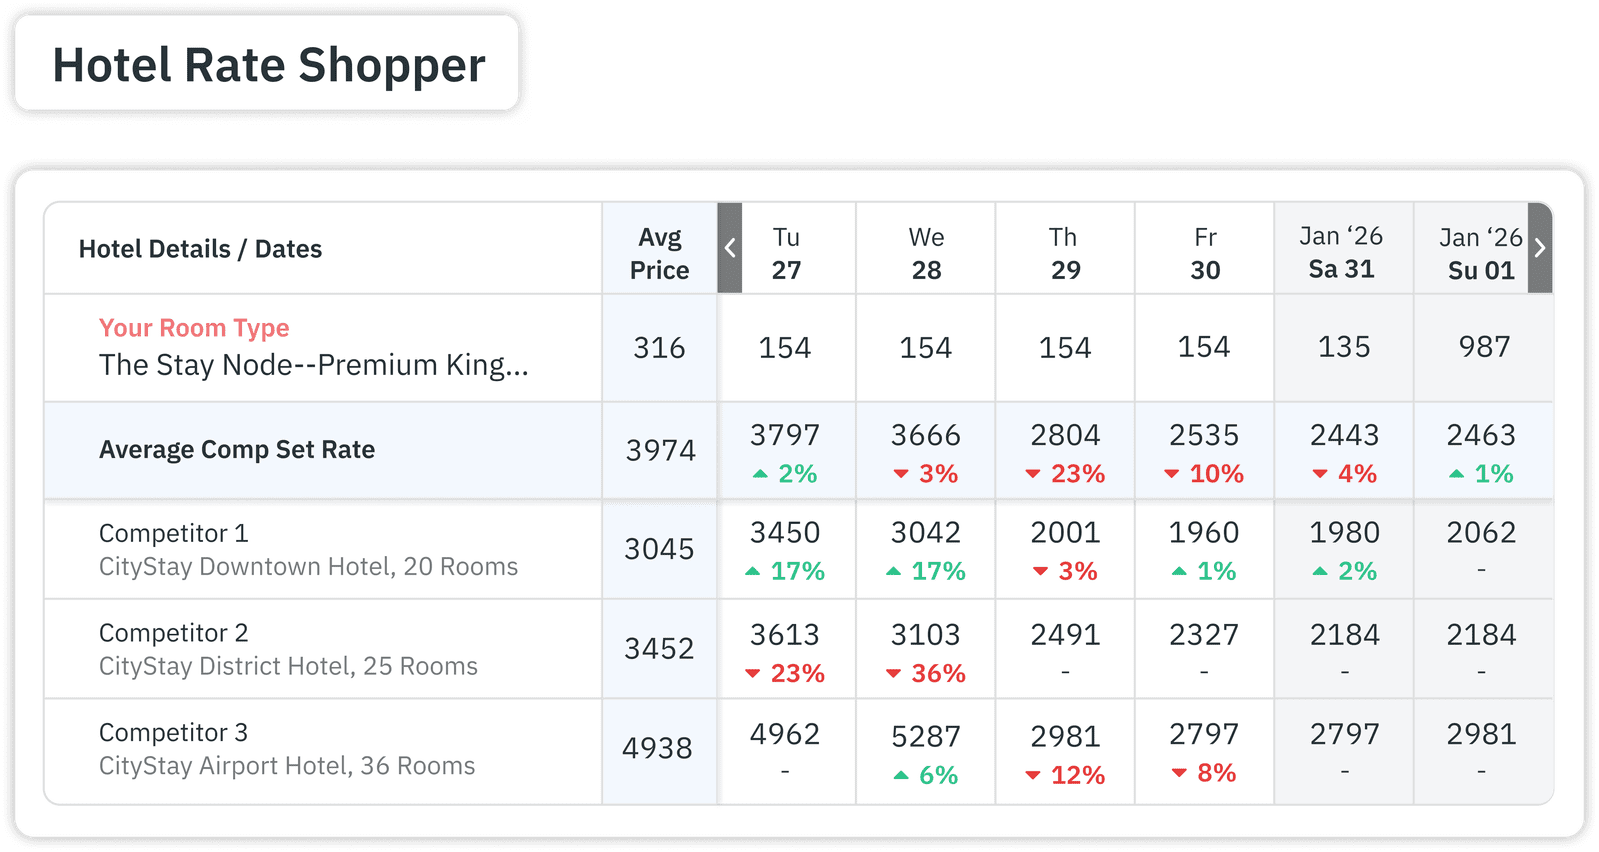
The Hotel Rate Shopper is your secret weapon here. It allows you to monitor pricing trends across up to 350 nearby properties. You can manually select specific rivals to create a Custom Comp Set, ensuring your hotel dynamic pricing success metrics are always compared against the right neighbors.
5. Booking Pace and Lead Time
Booking Pace measures how fast reservations are coming in for future dates. Lead Time is the average gap between booking and arrival. If your booking pace is too fast, your prices are likely too low. If it’s too slow, you might be missing the window to capture “early bird” travelers.
How to use this in PriceLabs

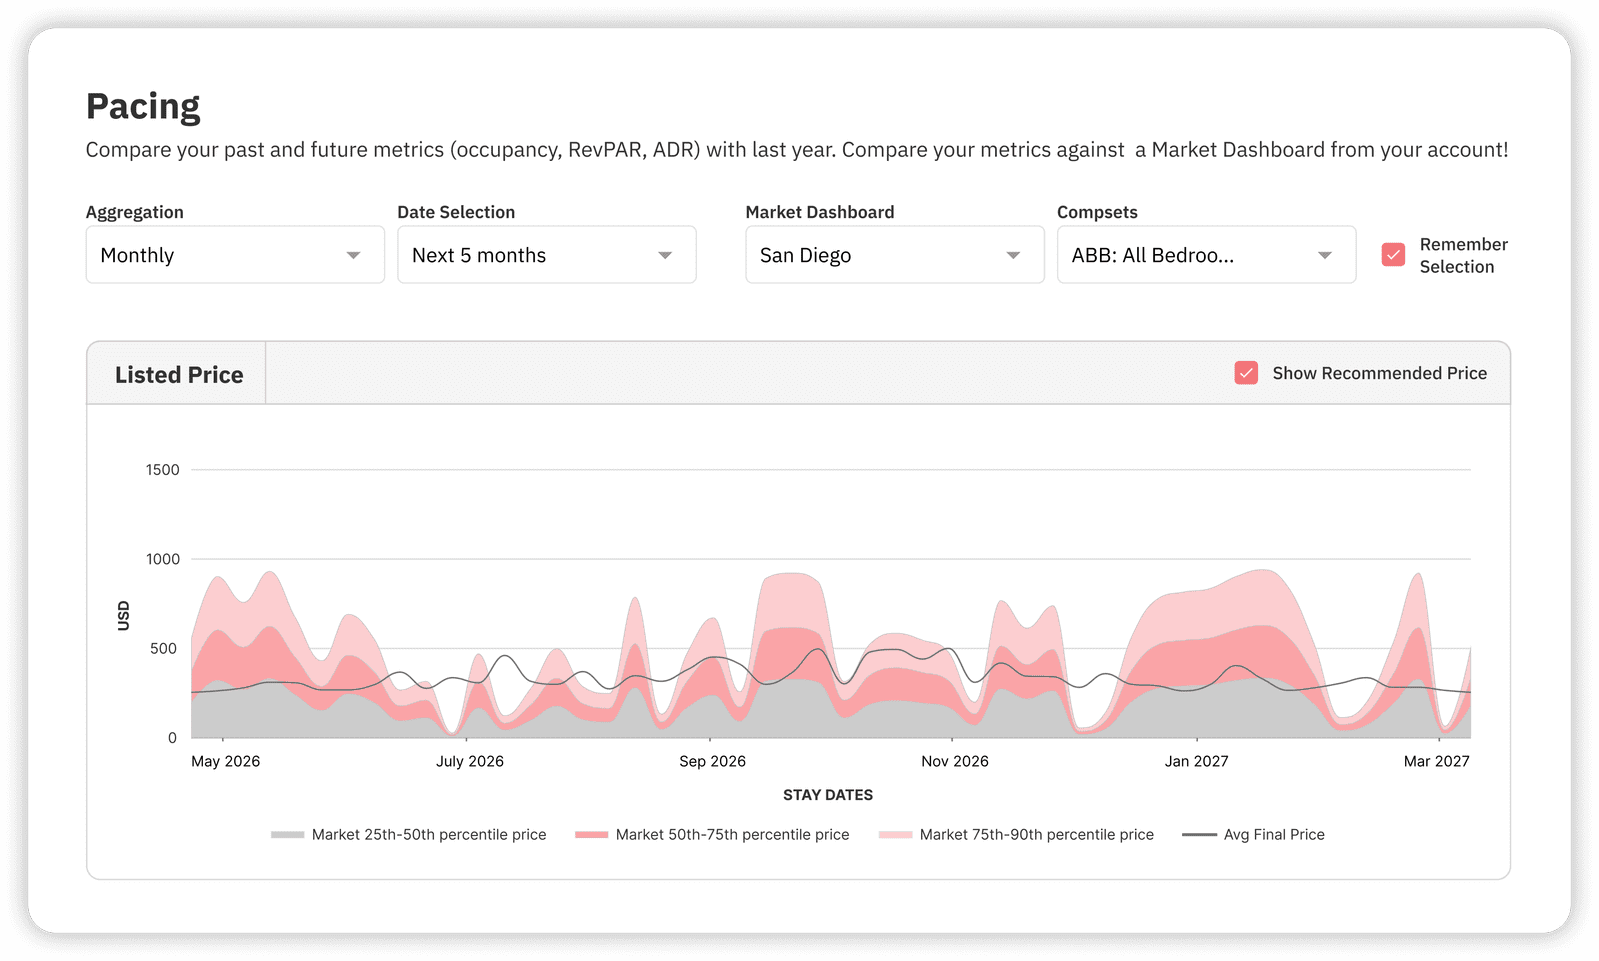
Check the Pacing Reports under Portfolio Analytics. These reports compare your current booking curve to last year’s performance or market trends. If you see a “flat” curve for a holiday weekend that is usually busy, you can immediately jump into your Customizations to adjust your Demand Factor Sensitivity.
6. Forecast Accuracy: The Precision Foundation
Successful dynamic pricing relies on high forecast accuracy. If your system predicts 90% occupancy but you only hit 60%, your rates were based on a “ghost” demand, causing you to lose revenue to competitors with more realistic prices.
Practical Step: Periodically compare your “On The Books” (OTB) data against your final month-end results.
How PriceLabs ensures accuracy:
The Hyper-Local Pulse Algorithm uses internal occupancy, lead times, and publicly available hotel market data to generate daily recommendations. To keep these insights fresh, PriceLabs offers Real-Time Sync (for select PMSs), which can trigger up to 24 price updates per day instantly following a new reservation or cancellation.
7. Distribution Mix and Direct Revenue Share
The final of our hotel dynamic pricing success metrics is about profit, not just revenue. Your distribution mix tracks where your bookings come from (OTAs like Expedia vs. your own website). High gross revenue is great, but if 25% is going to OTA commissions, your net profit suffers.
Optimizing Profit in PriceLabs:
PriceLabs supports Rate Plan Management. You can set a “base” recommended rate for your website and then apply a Pricing Offset (e.g., +15%) for OTA channels to cover commission costs automatically. This ensures that no matter where the guest books, your margin remains protected.
Conclusion
Tracking hotel dynamic pricing success metrics isn’t just about spreadsheets; it’s about gaining the freedom to focus on your guests while the data handles the heavy lifting. By moving from manual guesswork to an automated hotel pricing strategy, you aren’t just changing numbers—you’re building a more resilient, profitable business.
The Way Forward
- Audit Your Current KPIs: Do you know your RevPAR Index for next month?
- Leverage Smart Presets: If you’re new to PriceLabs, use Smart Presets to quickly apply hotel-specific settings like “Conservative” seasonality.
- Automate Your Reporting: Use the Report Builder to have a “Hotel KPIs On The Books” report delivered to your inbox weekly.
Frequently Asked Questions
What is RevPAR and why is it crucial for dynamic pricing success?
RevPAR (Revenue per Available Room) is calculated by dividing total room revenue by total available rooms. It is crucial because it accounts for both the price you charge (ADR) and how many rooms you actually fill (Occupancy), giving you the most accurate picture of your strategy’s effectiveness.
How can ADR growth indicate effective dynamic pricing strategies?
Growth in ADR (Average Daily Rate) signals that your hotel has “pricing power”. If your ADR rises after implementing dynamic pricing, it means the system is successfully identifying high-demand periods where guests are willing to pay a premium, rather than just selling out at low rates.
What occupancy rate improvements are realistic with dynamic pricing?
While results vary, many hotels achieve a 10–15% increase in occupancy. This happens because dynamic pricing identifies “slow” dates in advance and lowers rates just enough to attract bookings that would have otherwise gone elsewhere, particularly during the low season.
Why is forecast accuracy essential for automated pricing systems?
Forecast accuracy is the “brain” of the operation. If the forecast is wrong, the price will be wrong. Accurate forecasting prevents “inventory leakage” (selling too many rooms too cheap, too early) or “overpricing” (staying empty while neighbors fill up).