


In the fast-paced world of short-term rentals, being a “good” revenue manager is no longer enough. To stand out, you have to know how to be a great revenue manager, and that starts by shifting from a reactive to a proactive mindset.
Gone are the days of looking at last month’s spreadsheets and wondering why occupancy dipped. In 2026, the industry has evolved. Great revenue managers now use data analytics and dynamic pricing to fix problems before they even appear on the balance sheet.
Bonus Read: Vacation Rental Revenue Management: The Complete Guide for Hosts and Property Managers
Understanding Proactive Revenue Dashboards
A proactive revenue dashboard is a centralized command center that aggregates real-time portfolio KPIs, pricing signals, and operational alerts. Unlike static reports that tell you what happened, these platforms tell you what is happening and what will happen, allowing teams to intervene before they make any pricing mistakes or a revenue loss occurs.
From Static Reporting to Dynamic Action
In the past, managing rental prices was a slow, “wait and see” process. You had to review old data and manually update spreadsheets, often leaving you to react to changes too late. PriceLabs changes that by looking forward, not backward.
PriceLabs has taken the high-tech tools used by giant hotel chains and made them easy and affordable for everyone—whether you have one rental or a large portfolio. Instead of guessing, you can now use live data to automatically update your prices, making sure they always match the “pulse” of your local market.
How PriceLabs Does the Hard Work for You
Free Performance Tracking: PriceLabs gives you a free Portfolio Analytics tool that tracks how much money you’re making and how often your rooms are filled.


The “Neighborhood Expert” Algorithm: Most tools look at broad city trends, but the PriceLabs HLP algorithm zooms in on your specific street. It watches local supply, events, and holidays to find the “sweet spot” price for every single night of the year.
Spying on the Market: Use PriceLabs Market Dashboards to see exactly what your neighbors (your “Comp Set“) are doing. You can compare your rates against up to 10,000 nearby listings to see when they are getting booked, how long their guests stay, and even what amenities they have that you might be missing.


Smart Automation with You in Control: You can put 70–90% of your pricing on autopilot, but you’re still the boss. You can set your own rules for last-minute discounts, far-out bookings, and minimum-stay requirements. The system reacts instantly to market movements while staying aligned with your specific goals.


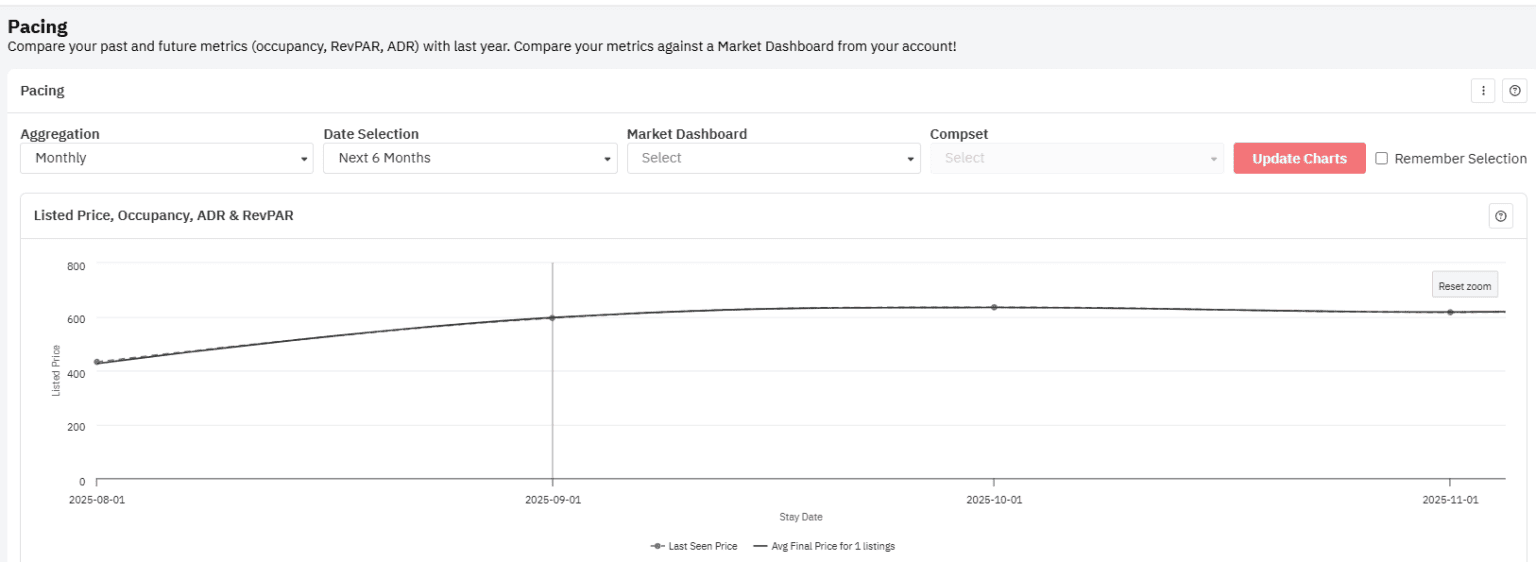
Future-Looking Reports: Don’t just look at last month; look at next year. Pacing Reports show you if you are booking faster or slower than the rest of the market. This lets you adjust your prices for dates over a year away before you miss out on revenue.

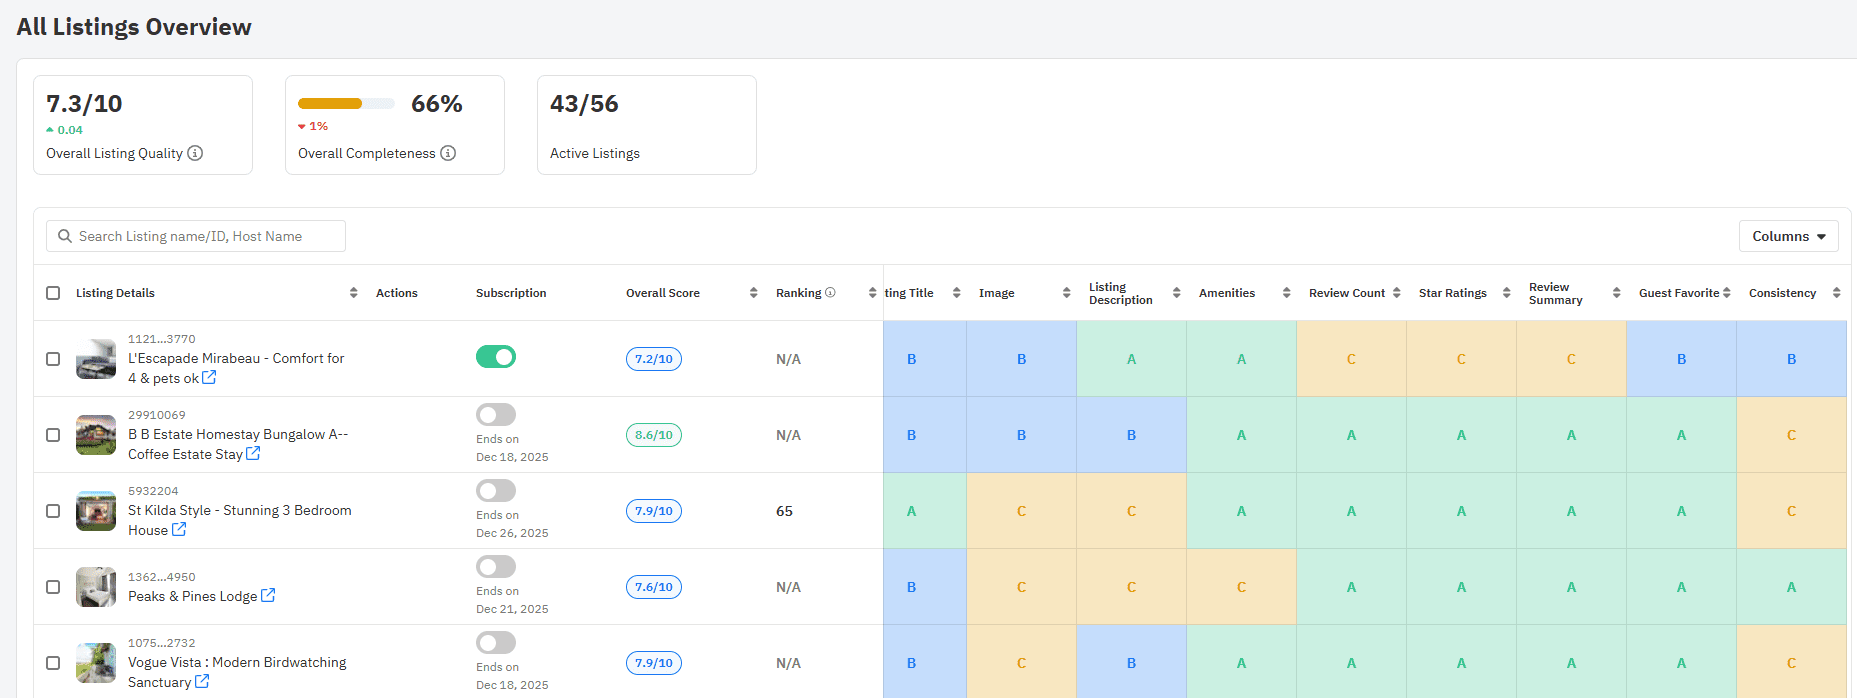
AI Tips & Better Listings: PriceLabs uses AI insights to turn complicated charts into simple, written advice. It also has the Listing Optimizer tool, which compares your Airbnb photos and descriptions to top sellers in your area, ensuring your page looks as good as your price.

By connecting directly to 160+ booking platforms and property management systems, PriceLabs ensures your smartest prices are automatically updated across all platforms. It turns the headache of pricing into your biggest competitive advantage.
Key Performance Metrics to Track in Real Time
To maintain a healthy portfolio, you need to monitor specific portfolio KPIs. Tracking these allows you to spot “demand soft spots” and adjust your dynamic pricing strategy instantly.
| Metric | Definition | Why It Matters |
| ADR | Average Daily Rate: Total revenue / Occupied nights. | Spots pricing opportunities during high-demand events. |
| Occupancy | % of available nights booked. | Signals if you are priced too high or missing out on volume. |
| RevPAN | Revenue per Available Night: Total revenue / Total available nights. | The “North Star” of profitability; balances rate and occupancy. |
| Lead Time | Days between booking and check-in. | Helps adjust “last-minute” vs. “early-bird” discount rules. |
| Net Revenue | Gross revenue minus all fees (OTA, CC, Ops). | Reveals true take-home pay and channel profitability. |
Pro Tip: Don’t just look at totals. Compare your ADR and RevPAN across regions or property types to see which segments are carrying the team and which need a strategy overhaul.
Building a Scalable Revenue Dashboard
For large portfolios, fragmentation is the enemy. To scale, you must integrate your Property Management System (PMS), OTA data, and accounting into a central BI (Business Intelligence) layer.
- Centralization: Connect your PMS and PriceLabs data into a single view to see channel performance side-by-side.
- Data Normalization: Ensure “ADR” means the same thing across Airbnb, VRBO, and direct sites.
- Role-Based Layers:
- Executives: High-level pacing and portfolio health.
- Analysts: Deep dives into comp-set benchmarks.
- Ops Teams: Maintenance and cleaning status alerts.
Put Your Strategy on Autopilot.
Don't spend your week manually chasing pacing gaps. Leverage PriceLabs' automated alerts and dynamic pricing to handle the routine, so you can focus on high-level strategy and market expansion. Join the thousands of property managers who automate up to 90% of their pricing actions.
Start Your free trialSetting Up Alerts and Automation to Stay Ahead
Great revenue managers don’t spend all day staring at screens; they let operational intelligence do the heavy lifting. By setting up automated alerts, you can move from monitoring to “management by exception.”
Prioritize These Alerts:
- Pacing Gaps: Automated notifications when future bookings for a specific month fall 10% behind your 3-year average.
- Sudden ADR Drops: Instantly flags when a competitor lowers rates significantly in your comp set.
- AI-Detected Risks: Modern AI can parse guest messages for keywords like “slow drain” or “dirty floor”. These trigger an operational alert before a guest leaves a 3-star review, which can kill your future ADR.
You can link these alerts directly to automated pricing actions. For example, if occupancy for next weekend is below 20%, the system can automatically trigger a “Gap Filler” discount without you lifting a finger.
Testing Pricing Strategies Without Revenue Risk
One of the biggest hurdles to being a great revenue manager is the fear of “breaking” what works. You can mitigate this through cohort segmentation and back-testing.
Safe Pricing Experiments
Instead of changing prices for all 500 units, select a test cohort (e.g., all 2-bedroom cabins in one region) and a control cohort.
- Apply the New Rule: Either change the minimum stay or offer an aggressive last-minute discount.
- Set Safety Rails: Use “Minimum Price” thresholds so the algorithm never drops below your break-even point.
- Validate via Back-Testing: Use historical data to simulate how the new price would have performed during last year’s festival season.
Rolling Out Dashboards and Driving Adoption
A dashboard is only useful if your team actually uses it.
- Phased Onboarding: Start with a pilot of 10–20 units. Train “power users” who can then champion the tool to the rest of the company.
- Look Beyond Pricing: Use your revenue management dashboard to negotiate. If data shows a specific OTA has a 25% cancellation rate compared to 5% for direct bookings, use that leverage to adjust your channel mix or negotiate better commissions.
- Ancillary Revenue: Track short-term rental upsell items such as early check-ins or pet fees. Often, these high-margin items can increase your Net Operating Income (NOI) by 5–10% without changing your nightly rate.
Frequently Asked Questions
What kind of dashboards and alerts should revenue managers use to stay proactive?
Great revenue managers use dashboards that integrate PMS and market data. Priority alerts include pacing shortfalls (lagging behind seasonal norms), pacing surges (allowing you to raise rates for high-demand events), and AI-flagged operational issues that could lead to bad reviews.
How do great revenue managers track performance metrics like ADR, RevPAR, and occupancy in real time?
They use a central BI layer, such as PriceLabs’ Portfolio Analytics. This allows them to see YOY comparisons and market benchmarks in one view, ensuring they aren’t just hitting targets, but outperforming the local market.
How can a revenue manager test pricing strategies without risking long-term revenue loss?
By using cohort segmentation (A/B testing) and setting automated safety rails, like floor prices. Back-testing strategies against historical data also ensures the logic holds up before it goes live.