


Events are the ultimate double-edged sword. For the prepared host, they represent the highest-revenue nights of the year—the “bonus” that pays for upgrades or offsets the slow season. For the unprepared, they are a source of “Airbnbust” headlines, empty calendars, and missed opportunities.
The 2023 Super Bowl in Phoenix remains a cautionary tale. While headlines screamed about $7,000-a-night rentals, the reality was a “fumble.” An oversaturated market and high hotel inventory left many hosts with 0% occupancy on what should have been their most profitable weekend. To avoid this, hosts must move beyond “gut-feeling pricing” and adopt a structured playbook.
By categorizing demand into Unknown, Recurring, and One-Time Events, and leveraging the PriceLabs ecosystem—Dynamic Pricing, Market Dashboards, Portfolio Analytics, and the STR Index—hosts can navigate these surges with surgical precision.
Dynamically Price Your Property and Get FREE Custom Reports Tailored To Your Property!
Use PriceLabs Dynamic Pricing to competitively and dynamically price your property according to demand shifts and analyze past performance to set a strong pricing strategy for your property.
Create your Account NowPhase 1: Protect your calendar with an always-on defense against unknown events
The most dangerous event is the one you don’t see coming. These are the surprise concerts, last-minute political rallies, or niche corporate conferences that haven’t hit the mainstream news yet. If your calendar is open 365 days in advance with “standard” pricing, a savvy traveler who tracks tour dates or conference schedules will book your property at a fraction of its true market value.
The Taylor Swift Effect: A Lesson in Predictive Data
PriceLabs’ data from the Phoenix market during the announcement of the Eras Tour serves as a perfect example. Immediately following the tour date release, the “Hyper Local Pulse” algorithm detected a massive, instantaneous shift in forecasted occupancy. While manual hosts were still sleeping, automated systems were already adjusting rates to match the incoming tidal wave of demand.
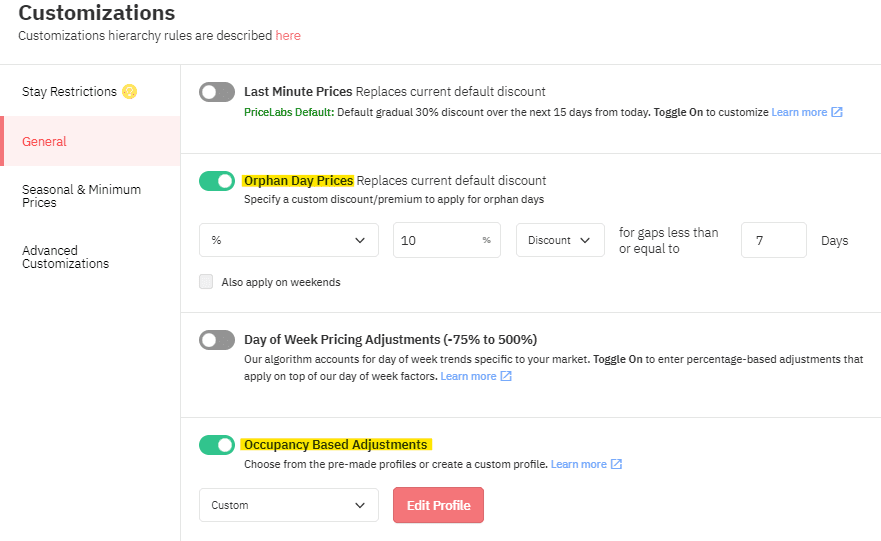
Dynamic Pricing Overrides: Don’t leave your far-out prices at your Base Price. Use your pricing tool to set a higher floor for dates further than 180 days out. This ensures that if someone books a year in advance, they are paying a premium for the privilege of early security.


Yield Management: Use Occupancy-Based Adjustments. If your property (or your local market) reaches 20% occupancy six months in advance, your prices should automatically increase. This “defensive” pricing ensures you don’t sell out your best dates too cheaply.

Dynamically Price Your Property and Get FREE Custom Reports Tailored To Your Property!
Use PriceLabs Dynamic Pricing to competitively and dynamically price your property according to demand shifts and analyze past performance to set a strong pricing strategy for your property.
Create your Account NowPhase 2: Rich historic data allows you to master recurring events with precision
Recurring events are the backbone of a host’s high-season revenue. These are annual staples—festivals like the Gulf Coast Jam (GCJ), university graduations, or holiday weekends like Memorial Day. Because these events happen every year, we have the luxury of Same Time Last Year (STLY) data to guide our hand.
Case Study Deep Dive: Gulf Coast Jam 2026
Looking at the data for GCJ 2026, we see a fascinating trend that highlights why simply “copying last year” isn’t enough.
1. The Pacing Variance
As of late 2025, GCJ 2026 is pacing significantly ahead of the 2025 event. Market occupancy for the festival dates is currently at 15–20%, more than double the occupancy at the same time last year. This suggests that the 2026 lineup or market sentiment is stronger, and a host who only looks at last year’s final ADR (Average Daily Rate) will likely underprice their home.
2. The Booking Window Reality
The data shows that despite the early surge, the “heart” of the booking window is still to come. Historically, 50% of total bookings for this event happen within 65 days of the start date, with the final 30 days seeing the most aggressive “pickup.”
Host Strategy: Do not panic if you aren’t booked four months out. If you are already booked, you were likely too cheap. Trust the historical booking window and hold your price floor until the 60-day mark.
3. Identifying the Clean Comparison
To find your true “Event Premium,” you must use the STR Index or Market Dashboards to find a “clean” weekend—a weekend with similar seasonality but no event.

For GCJ, comparing the festival weekend to July 31st (a standard peak summer weekend) reveals a 50th percentile price difference of $433, down from $500. This identifies a 15.4% Event Premium. This is the “science” behind your markup.
Dynamically Price Your Property and Get FREE Custom Reports Tailored To Your Property!
Use PriceLabs Dynamic Pricing to competitively and dynamically price your property according to demand shifts and analyze past performance to set a strong pricing strategy for your property.
Create your Account Now4. The Stay-Length Constraint
Data for GCJ 2026 shows that 81% of current bookings are for 3–6 nights.
Tool Integration: Use Dynamic Pricing to set “Cascading Minimum Stays.” Start with a 5-night minimum, 6 months out, to capture the “Whales.” As the event approaches (45 days out), drop the minimum to 3 nights to fill the remaining gaps.


Phase 3: Navigating the One-Time Event (The High-Risk/High-Reward Play)
One-time events, such as a Super Bowl in a new city or a Total Solar Eclipse, are high-risk because the “Supply” side of the equation is volatile. When an event is massive, thousands of “casual hosts” (homeowners who usually don’t rent) flood the market, radically increasing supply and potentially crashing the ADR.
Case Study: The Super Bowl Supply Shift (New Orleans vs. Santa Clara)
The data for Super Bowl LIX (New Orleans, 2025) and Super Bowl LX (Santa Clara, 2026) illustrate two very different market trajectories.
New Orleans: The Oversaturation Risk
In New Orleans, active listings for the Super Bowl period surged by 18% year-over-year, jumping from 848 to over 1,000 listings. When supply grows faster than demand, even a “mega-event” can see ADRs struggle.
- Strategy: Use Market Dashboards to monitor “New Supply.” If you see a massive spike in new listings in your neighborhood, you may need to be more competitive with your pricing rather than holding out for a “lotto” price.


Santa Clara: The Scarcity Opportunity
Conversely, Santa Clara is seeing an 8.4% decrease in active listings for the 2026 Big Game. Lower supply, combined with massive demand, creates a significant opportunity for aggressive pricing.
- Strategy: In a supply-constrained market, look at the 75th and 90th percentile pricing in your Market Dashboard. For Super Bowl 2026, the data shows that while the “median” price is dipping slightly, the luxury/top-tier prices are actually trending up. This indicates that high-end travelers are still willing to pay a premium.
Dynamically Price Your Property and Get FREE Custom Reports Tailored To Your Property!
Use PriceLabs Dynamic Pricing to competitively and dynamically price your property according to demand shifts and analyze past performance to set a strong pricing strategy for your property.
Create your Account NowThe Milestone Pricing Model
One-time events don’t book in a linear fashion. They book in “pulses” based on external triggers:
- Announcement/Season Kickoff (~140 Days Out): The first wave of corporate and “super-fan” bookings.
- Playoff Certainty (~30 Days Out): When fans know their team has a realistic shot.
- The Finals Decide (~14 Days Out): The “FOMO” (Fear Of Missing Out) wave. This is where the highest ADRs often occur, but only if supply isn’t oversaturated.
Phase 4: Dynamic pricing tools help you optimize you pricing
To execute these playbooks, a host must move fluidly between four key areas of the PriceLabs platform:

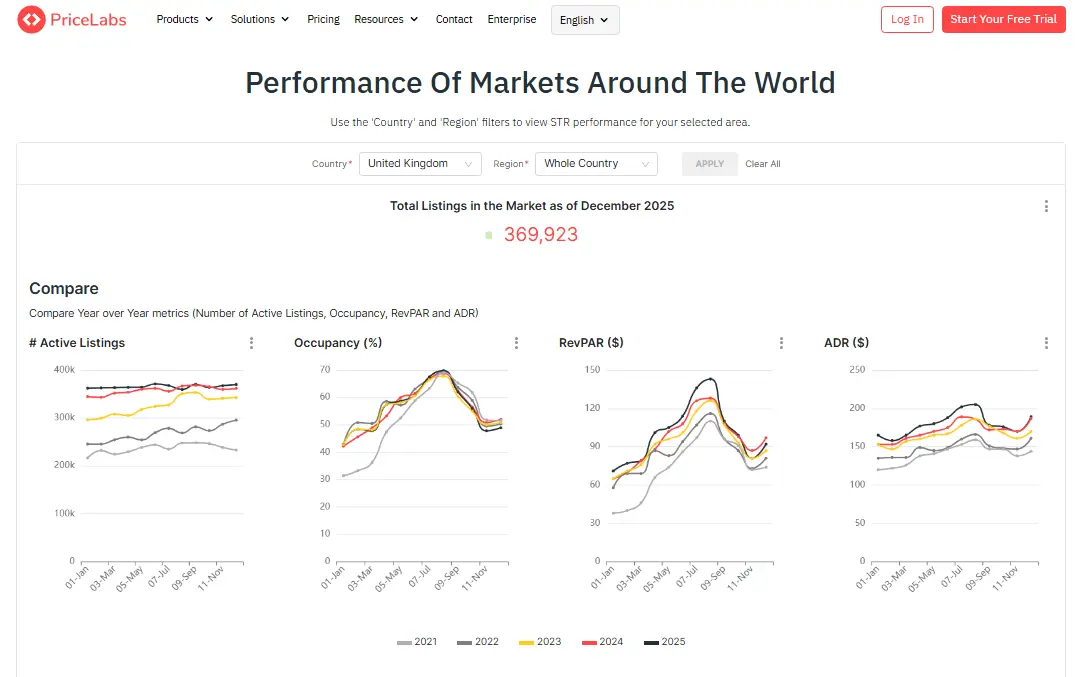
1. STR Index (The Macro View)
Before you look at your own home, look at the world. The STR Index lets you see whether the event’s demand is a local anomaly or part of a broader trend. Is the entire Gulf Coast seeing a surge, or just your specific festival grounds? This helps you determine whether to price for “neighborhood demand” or “regional demand.”
2. Market Dashboards (The Future View)
This is your “Forward Pacing” engine. It allows you to see:
- Future Occupancy: What % of your competitors are booked for Super Bowl Sunday?
- Lead Time: How many days in advance are the “expensive” bookings happening?
3. Portfolio Analytics (The Internal View)
Use this to compare your “Current Pacing” against the “Market Pacing.” If the market is 40% booked for an event but you are 80% booked, you have underpriced. Portfolio Analytics gives you the “Stop Light” signal:

- Red: You are booking too fast; raise prices.
- Green: You are pacing perfectly with the market.
- Yellow: You are under-pacing; check your listings’ photos or slightly lower your floor.
Dynamically Price Your Property and Get FREE Custom Reports Tailored To Your Property!
Use PriceLabs Dynamic Pricing to competitively and dynamically price your property according to demand shifts and analyze past performance to set a strong pricing strategy for your property.
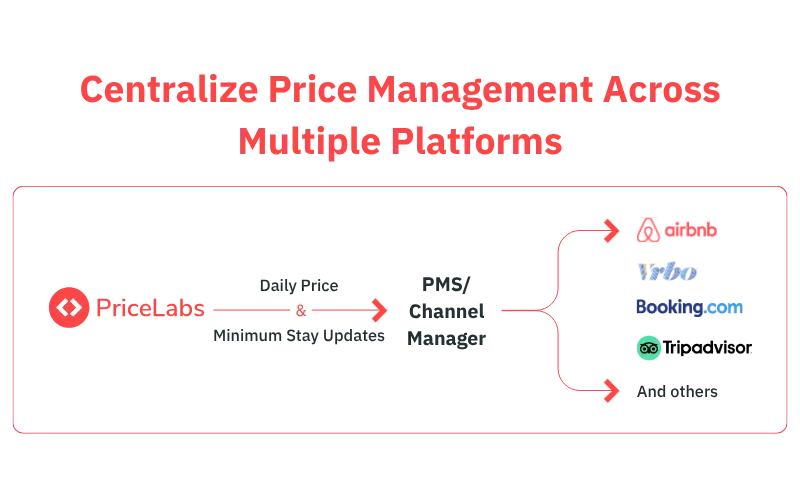
Create your Account Now4. Dynamic Pricing (The Execution Engine)
This is where the rubber meets the road. All the data in the world is useless if you don’t update your rates daily. Dynamic Pricing takes the “Hyper Local Pulse” and “Event Premium” data and automatically pushes it to your PMS/Airbnb/VRBO. It ensures that if a competitor drops their price at 2 AM, or if a new block of hotel rooms opens up, your price reacts instantly.

Conclusion: Winning the Event-Based Pricing Game
Mastering event-based pricing is not about finding one “magic number” and leaving it. It is a game of constant adjustment.
- Protect your calendar from unknown events by using automated far-out premiums.
- Analyze recurring events using the STLY (Same Time Last Year) data found in the STR Index and GCJ case studies.
- Monitor one-time events, such as the 18% listing spike in New Orleans, using Market Dashboards.
- Automate the entire process with Dynamic Pricing to ensure you are always the first to react to market shifts.
By following this playbook, you move from being a “passive observer” of market trends to an “active orchestrator” of your revenue. Don’t let your next major local event be a “fumble”— use the data, trust the tools, and capture the revenue your property deserves.