

Managing multiple short-term rental listings means juggling different markets, guest expectations, and seasonal trends—all at once. Without a centralized way to view performance, many hosts rely on gut feeling or disconnected spreadsheets to make decisions. That’s risky.
Portfolio analytics solves this by giving you a unified view of your Airbnb business. Instead of zooming in on one listing at a time, you can track occupancy, revenue, and performance across your entire portfolio. This lets you spot what’s working, fix what’s not, and grow with confidence.
In this article, we’ll walk you through PriceLabs’ Portfolio Analytics tool—what it shows, how to use it, and why it matters. Whether you’re managing two listings or twenty, you’ll learn how to analyze your data, identify trends, and make smarter decisions that improve your bottom line.
Portfolio Analytics is FREE with your PriceLabs Account!
Create a FREE account with PriceLabs now and implement a smart pricing strategy based on market conditions, seasonality & competition for excellent ROI. And get a FREE comprehensive reporting system for your entire portfolio.
Create Your FREE Account Now!What Is Airbnb Analytics and Why Should You Care?
Airbnb analytics (also known as short-term rental analytics or vacation rental data analysis) helps you understand how your listing is performing based on real data, not guesswork. Whether you’re managing one property or a growing portfolio, having the right insights lets you make smarter, more profitable decisions.
Instead of relying on instincts alone, Airbnb analytics tools show you:
- How far in advance guests are booking (your booking window or lead time)
- How many nights are getting booked and at what nightly rate
- Whether you’re getting bookings faster or slower than you were last year
- How your prices compare to other similar listings nearby
- Which listings or booking channels are bringing in the most revenue
By regularly tracking this kind of data, you get a clear view of your current performance and where you’re headed.
Why Airbnb Analytics at the Portfolio Level Matters
Most hosts start by optimizing one listing at a time. But once you manage more than a couple of properties, you need to stop thinking like a host and start thinking like a business owner.
1. Tracking Overall Performance Beyond Individual Listings
Airbnb’s native dashboard offers decent insights for each listing, but it doesn’t show how your entire portfolio is performing. Without that, you can’t:
- Compare occupancy across cities or property types
- Identify which listings are driving most of your revenue
- Spot gaps or patterns across multiple units
Portfolio analytics gives you exactly that. It shows trends in your occupancy, ADR (average daily rate), RevPAR, and more—across all listings in one place.
2. Spotting Trends, Not Just Snapshots
When you look at one listing in isolation, it’s easy to misread short-term fluctuations. Portfolio-level insights help you:
- Track performance over time
- Understand seasonal patterns across regions
- Identify underperformers before they drag down revenue
Instead of reacting to one bad week, you’re empowered to make data-backed decisions that improve your entire business.
Key Airbnb Analytics Metrics Every Host Should Know
When it comes to understanding your short-term rental performance, a few key numbers matter most. These are called KPIs (Key Performance Indicators), and PriceLabs makes them easy to track.
Here are the most important ones:
- Occupancy Rate – How many nights are booked vs. available
- ADR (Average Daily Rate) – Your average nightly price
- RevPAR (Revenue Per Available Room) – A mix of occupancy and ADR
- Booking Window / Lead Time – How far in advance guests are booking
- Length of Stay (LOS) – Average number of nights per booking
These Airbnb analytics help you see what’s working and where you might need to make changes.
Maximize Your Vacation Rental Return with Dynamic Pricing and Understand Your Portfolio Performance With Portfolio Analytics!
Boost occupancy & optimize revenue with PriceLabs’ Dynamic Pricing & Revenue Management tool. Implement a smart pricing strategy based on market conditions, seasonality & competition for excellent ROI.
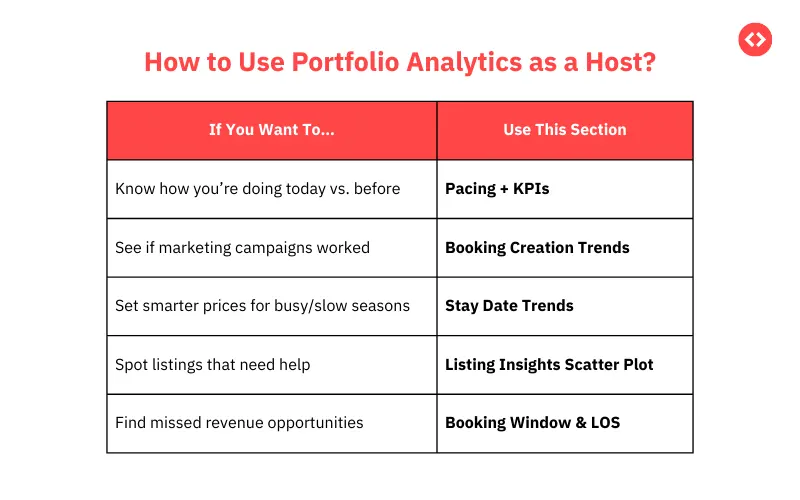
Start Your FREE Trial NowInside the Portfolio Analytics Dashboard
The Portfolio Analytics tool from PriceLabs gives you two key views:
1. KPIs & Historic Reports
This part of the dashboard is all about past and recent performance. You can compare:
- Bookings made in the last 30 days vs. the 30 days before
- Year-over-year performance (this year vs. last year)
- Trends by stay date (when guests stayed) or booking date (when they booked)
You’ll see charts that show:
- Revenue
- ADR
- Occupancy
- Booked Nights
- Number of Bookings
- Check-ins / Check-outs

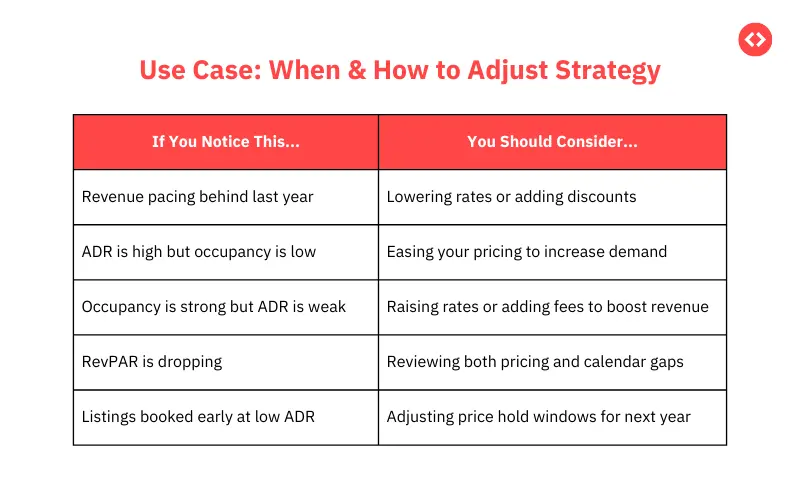
These charts help you spot trends and make better pricing decisions. For example:
| Scenario | What to Do |
| Bookings are down for the same period last year | Consider lowering your rates or offering a promo |
| You dropped prices, but revenue didn’t increase | Use the Revenue chart to see if the strategy worked |
2. Trends by Booking Creation Date
Want to know if your ad campaign worked? Or how far in advance people are booking? This section helps you figure that out.

Use it to track:
- Revenue after promotions
- Booking spikes after running ads
- Booking window trends to plan discounts
For example:
| Challenge | What to Check |
| Not sure if last-minute discounts are worth it? | See when guests actually book using the Avg. Booking Window chart |
| Ran a Facebook ad last week? | Look at unique bookings after the campaign launch |
Booking Window & LOS (Length of Stay) Trends
This section is great if you want to go deeper and spot booking patterns.

You can:
- See how far in advance guests book short vs. long stays
- Avoid offering discounts too early if most bookings happen closer to check-in
- Compare your data to the market to find pricing gaps
Let’s say you only allow 3-night stays but the data shows guests in your area often book 2-night stays last-minute. That means you’re missing out. Portfolio Analytics helps you see that and decide if lowering your minimum stay is worth it.
Listing-Level Metrics: Zoom in on Specific Properties

If you manage more than one listing, this feature is a game-changer.
- Use a scatter plot to spot listings that aren’t performing well
- Quickly find which ones have low occupancy and haven’t been booked in a while
- Filter by listing, see exact numbers, and click directly into the calendar to take action
You can also sort and filter your listings in a table for deeper insights.
Good to Know
- The dashboard updates daily with the latest data from your PMS or channel manager
- You can choose what metrics to compare and customize the date ranges
- Revenue can be broken down into base price, fees, taxes, and even deposits (depending on your PMS)
Supported PMSs for detailed revenue data include: Guesty, Hostaway, Lodgify, Vrbo, Cloudbeds, iGMS, and many more.

Whether you’re managing one property or many, Portfolio Analytics gives you the insights you need to take control of your bookings, pricing, and performance.
What Is Pacing Intelligence (and Why It’s Super Useful for Hosts)?
Pacing intelligence tells you if you’re getting bookings faster or slower than expected. It helps answer: “Am I doing better than last year? And how do I compare to other similar listings in my area?”
Let’s say it’s July, and you’re looking at bookings for August:
| Booked Nights for August | You Last Year | You This Year | Similar Listings |
| Nights Booked (as of July 1) | 20 nights | 25 nights | 35 nights |
- You’re doing better than last year (25 vs. 20)— good!
- But you’re still behind the market (25 vs. 35)— something to improve.
This is pacing in action. It doesn’t just show you how many nights are booked—it tells you if you’re ahead, behind, or right on track compared to where you should be.
With pacing insights from an Airbnb analytics tool like PriceLabs, you can:
- Spot slow booking months early and offer discounts
- Raise prices if demand is strong
- Make smarter decisions about your minimum stays or booking windows
It’s like having a weather forecast for your bookings—you don’t wait for it to rain. You plan ahead.
And if you’re using a free Airbnb analytics tool like PriceLabs’ Portfolio Analytics, you’ll also unlock something incredibly useful: pacing intelligence. It’s a powerful way to see if your future bookings are keeping up with demand—or falling behind—so you can take action in time.
Pacing vs. Projections: What’s the Difference?
Let’s break it down:
- Pacing tells you how your current bookings compare to past performance or the market.
- Projections estimate where you’re likely to end up, based on trends and forecasts.
Think of pacing as a real-time check-in. It shows whether you’re ahead or behind on bookings compared to last year or your local competitors. Projections, on the other hand, are like predictions—they help you plan but aren’t rooted in what’s happening right now.
Using Portfolio Analytics, you can monitor your pacing and take action early—like adjusting your pricing or minimum stays—if you’re not booking as fast as you should be.
Mastering Portfolio Analytics: Using Pacing Reports to Track and Adapt
Once you’ve learned how to read your portfolio KPIs like occupancy and ADR, the next step is knowing when to make changes. That’s where Pacing Reports come in.
Pacing Reports let you compare your future performance against the past (e.g., this time last year) and against the market (e.g., similar listings in your area). With this real-time view, you can quickly spot slow months, adjust pricing, or take advantage of early demand spikes.

Let’s look at how to use this data to stay ahead—and grow your short-term rental business.
Key Metrics to Track in Pacing Reports
Here are the four most important Airbnb analytics metrics to monitor inside your Portfolio Analytics pacing charts:
1. Listed Price


- What it is: The nightly rate currently shown on booking platforms.
- Why it matters: If your listed price is much higher than competitors, it could hurt occupancy. Too low, and you’re leaving money on the table.
- How to use it: Pacing Reports let you see if your pricing strategy aligns with market trends so you know when to raise or lower rates.
2. Occupancy

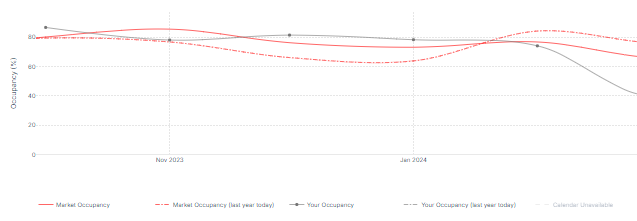
- What it is: The percentage of nights booked out of the total nights available.
- Why it matters: High occupancy is great, but only if you’re charging the right price. Low occupancy may signal demand issues or poor visibility.
- How to use it: Track occupancy over time to see if your listing is filling up faster or slower than in previous months or years. This helps you react early.
3. ADR (Average Daily Rate)

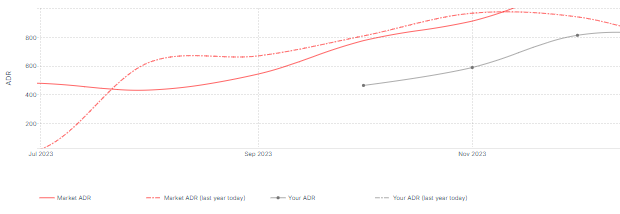
- What it is: The average nightly rate guests are paying for booked nights.
- Why it matters: A high ADR is great, but only if occupancy is healthy too. If ADR is too high, you might scare off last-minute bookers.
- How to use it: Compare your ADR with the market and your past to determine if your rates are competitive or if they need tweaking.
4. RevPAR (Revenue per Available Room)


- What it is: A combined measure of ADR and occupancy. Formula: ADR × Occupancy.
- Why it matters: It’s one of the best metrics to understand total performance. You might have high occupancy, but if rates are low, RevPAR will reflect that.
- How to use it: Use RevPAR trends to understand if you’re making the most of your calendar.
Reading the Graphs in Pacing Reports
Each pacing chart in Portfolio Analytics helps you track one of the four key metrics—Revenue, Occupancy, ADR, and RevPAR—over time.
You can view:
- Past 1 month + Next 6 months (default view)
- Or compare custom date ranges
- And do year-over-year comparisons
Here’s how to read and use them:
1. Revenue Trends (Current Dates & Custom Comparisons)

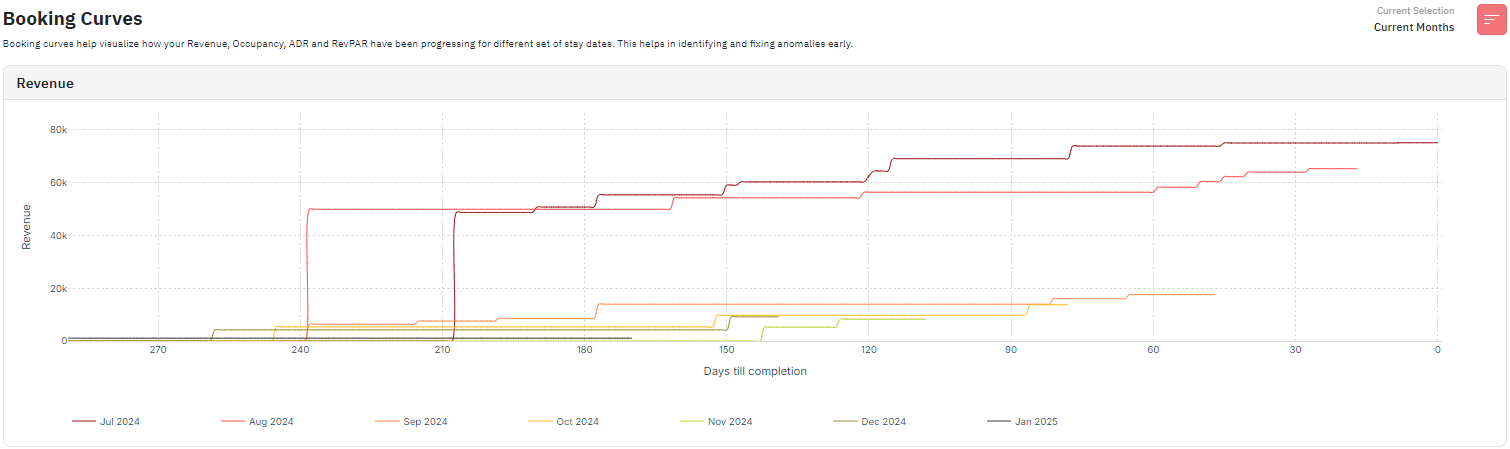
- What you see: A line chart showing how much revenue your listing has earned so far for future months.
- What to look for: Are you earning more or less revenue compared to the same time last year? Are there spikes due to holidays or events?
Example: You manage a listing in Paris. The chart shows August 2024 bookings filled up faster than usual. Why? Because of the Olympics. This tells you to increase rates earlier next year when similar demand is expected.
2. Occupancy Trends (Current Dates & Year-over-Year)

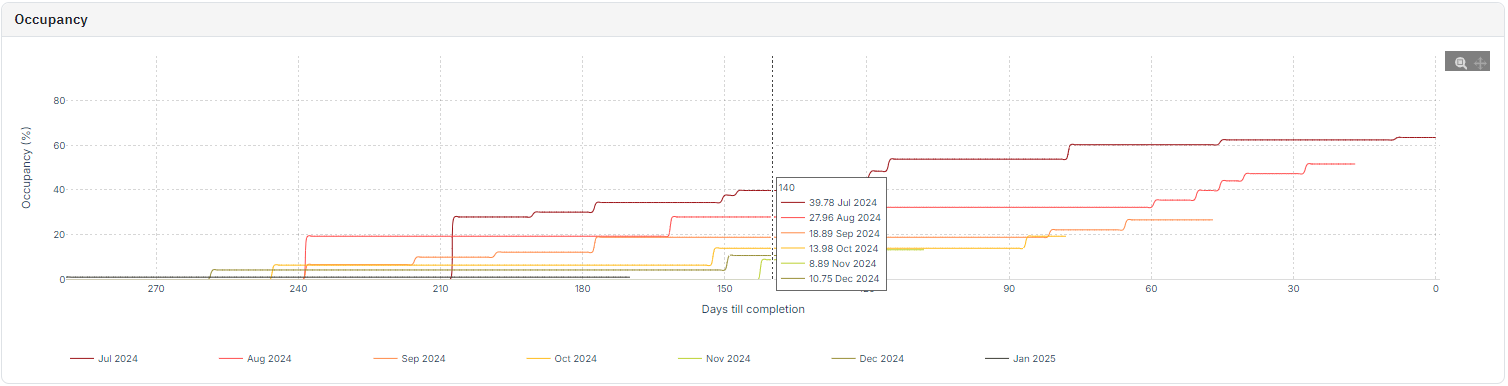
- What you see: Occupancy percentage over time.
- What to look for: How fast is occupancy picking up? Did last year perform better? Are you on track?
Example: If you’re at 30% occupancy for September and were at 45% by this time last year, it’s time to act. Try promotions, shorter minimum stays, or pricing tweaks.
3. ADR Trends (Current Dates & YOY)


- What you see: Average daily rate over time for upcoming dates.
- What to look for: Are your prices dropping too fast? Did you get higher-paying bookings earlier last year?
Example: You notice that your ADR in August is lower than last year. The bookings came in early this year—but at lower rates. This tells you to hold your price longer next year to capture higher-paying guests.
4. RevPAR Trends (Current Dates & YOY)

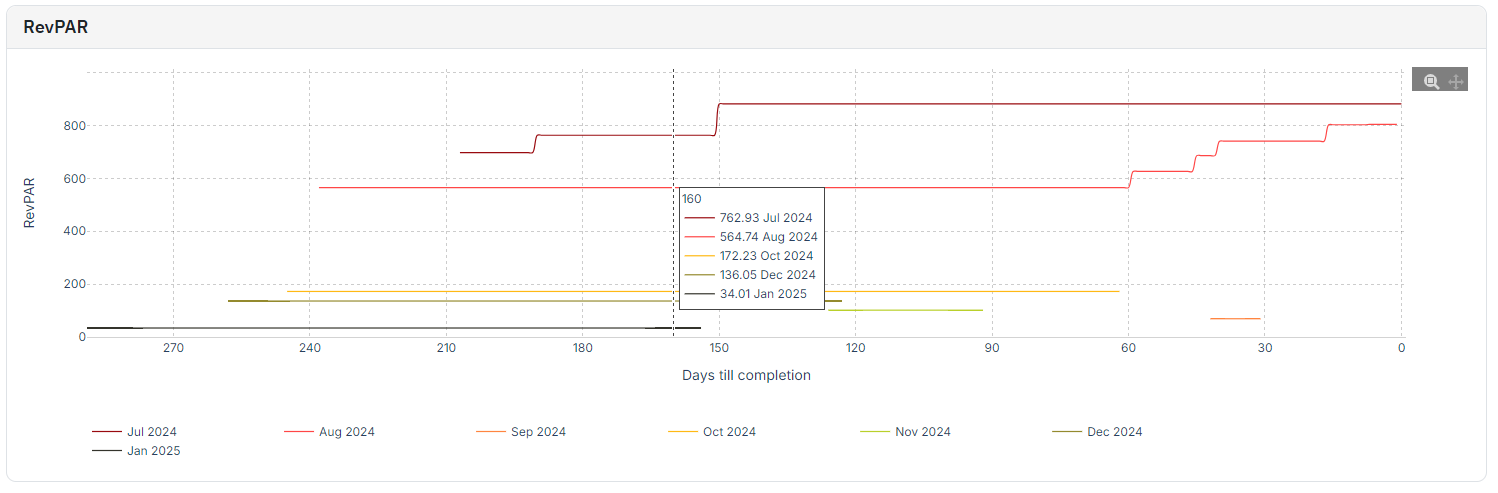
- What you see: A blend of occupancy and ADR—your true revenue efficiency.
- What to look for: Are you improving overall performance? Or just shifting the balance between rate and occupancy?
Example: In March, your ADR is high, but occupancy is low; so RevPAR is flat. In April, occupancy picks up and RevPAR jumps. This helps confirm that your price drop in April worked.
From Numbers to Strategy: Make Every Booking Count
Portfolio Analytics isn’t just a dashboard—it’s a decision-making tool that helps you run your short-term rental business with clarity and control. By tracking key metrics like occupancy, ADR, and pacing in real time, you can move beyond guesswork and make smarter choices that directly impact your revenue. Instead of reacting to last-minute booking gaps or pricing missteps, you can spot trends early, compare your performance to the market, and adjust your strategy with confidence.
Whether you manage one property or many, understanding your numbers helps you take action where it matters most—maximizing income while improving long-term performance. With the right insights, every booking becomes more than a transaction—it becomes a step toward sustainable growth. If you’re ready to run a more profitable, data-driven business, Portfolio Analytics is where that journey starts.