Get started with PriceLabs now!
Want to learn what PriceLabs can do for you? See for yourself with a free trial. Get started now!
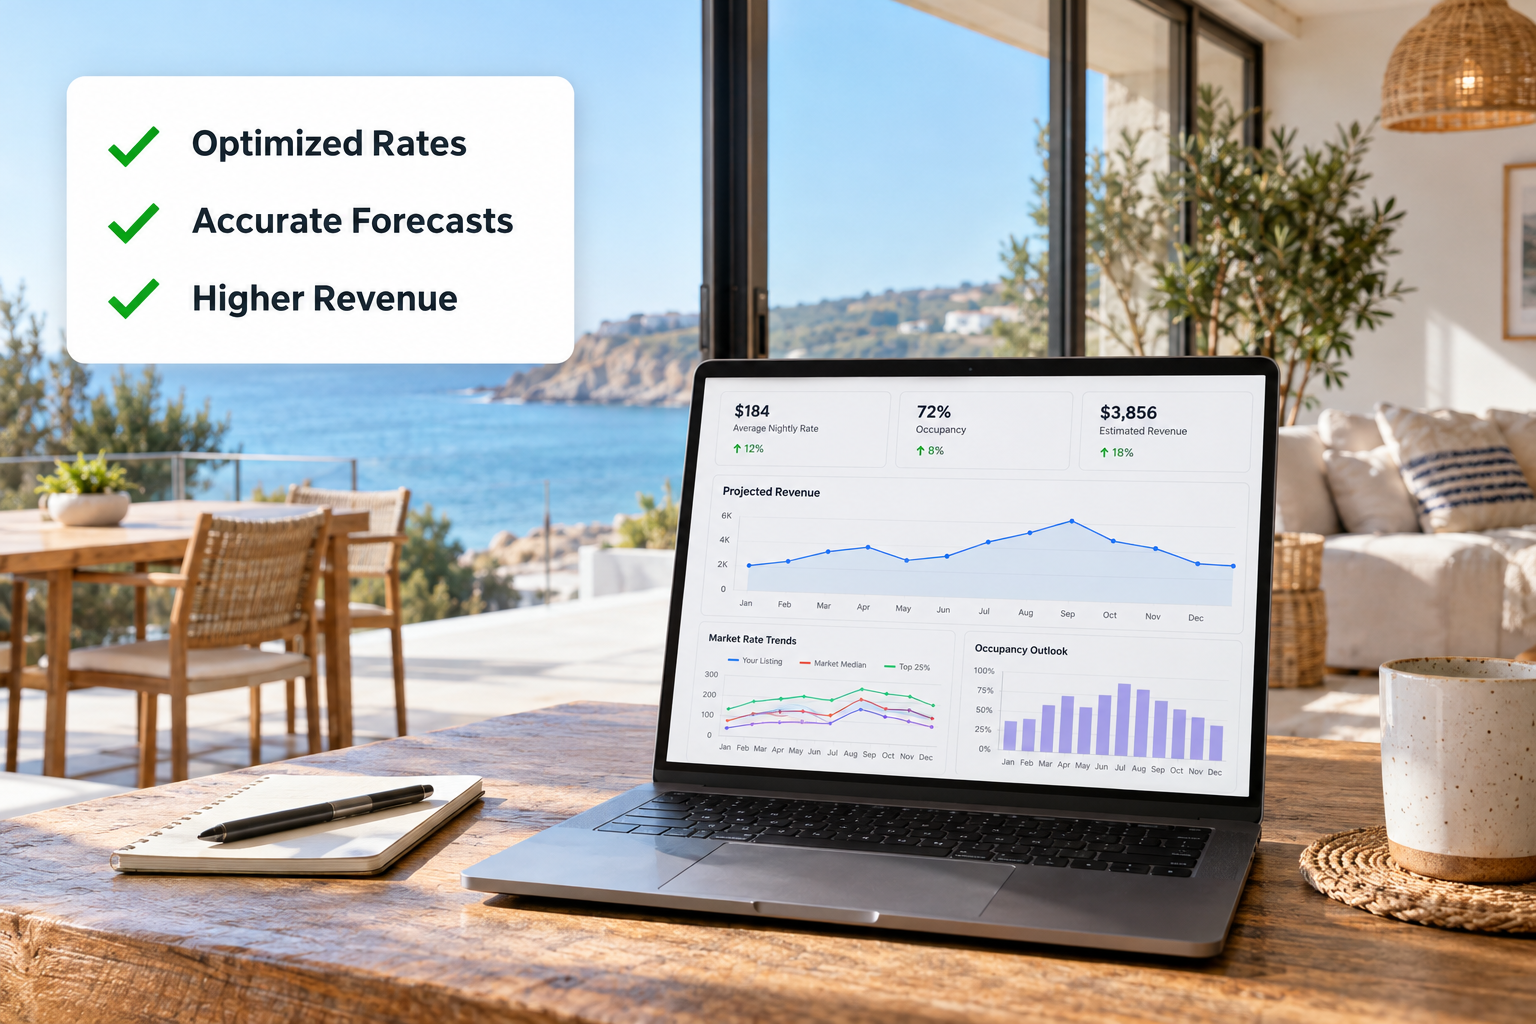
An Airbnb revenue projection estimates what a listing can earn by multiplying a market's ADR, its occupancy and the number of nights the listing is available. In our Market Dashboards, a comp set of similar listings shows the occupancy, ADR and RevPAR that serve as the market inputs. This guide covers each step of building a projection, from creating a dashboard to sharing the results, with a worked example and the limits of the data.
Revenue equals ADR multiplied by booked nights. Booked nights equal occupancy multiplied by available nights. A revenue projection therefore needs three inputs: ADR, occupancy and the number of nights a listing is open to reservations.
RevPAR is occupancy multiplied by ADR, so RevPAR multiplied by available nights gives projected revenue.
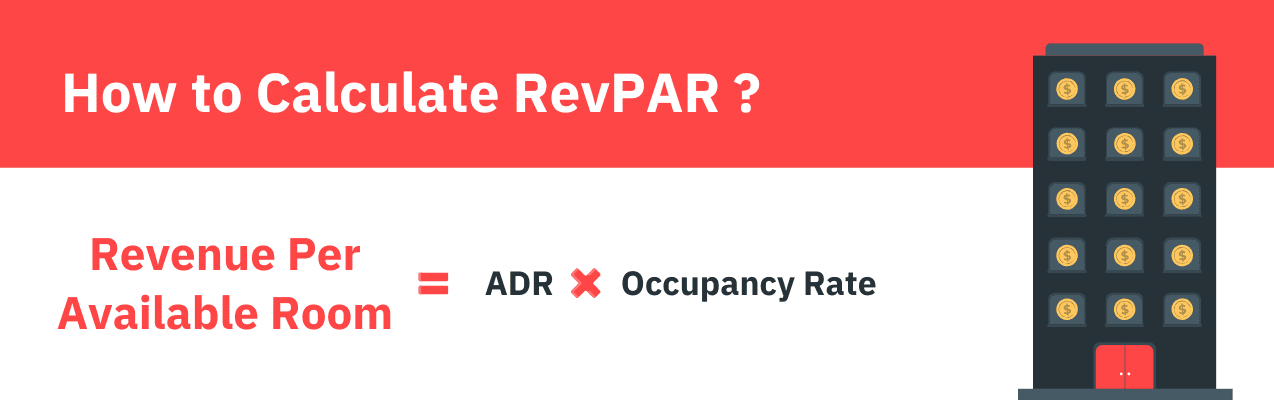
ADR counts booked nights only and excludes the prices of open nights. Two listings with the same ADR can have very different RevPAR when one has 80% occupancy and the other has 50%.
The Key Performance Indicators section shows eight KPIs for the past 7, 30 or 365 days, each compared with the previous period of the same length.
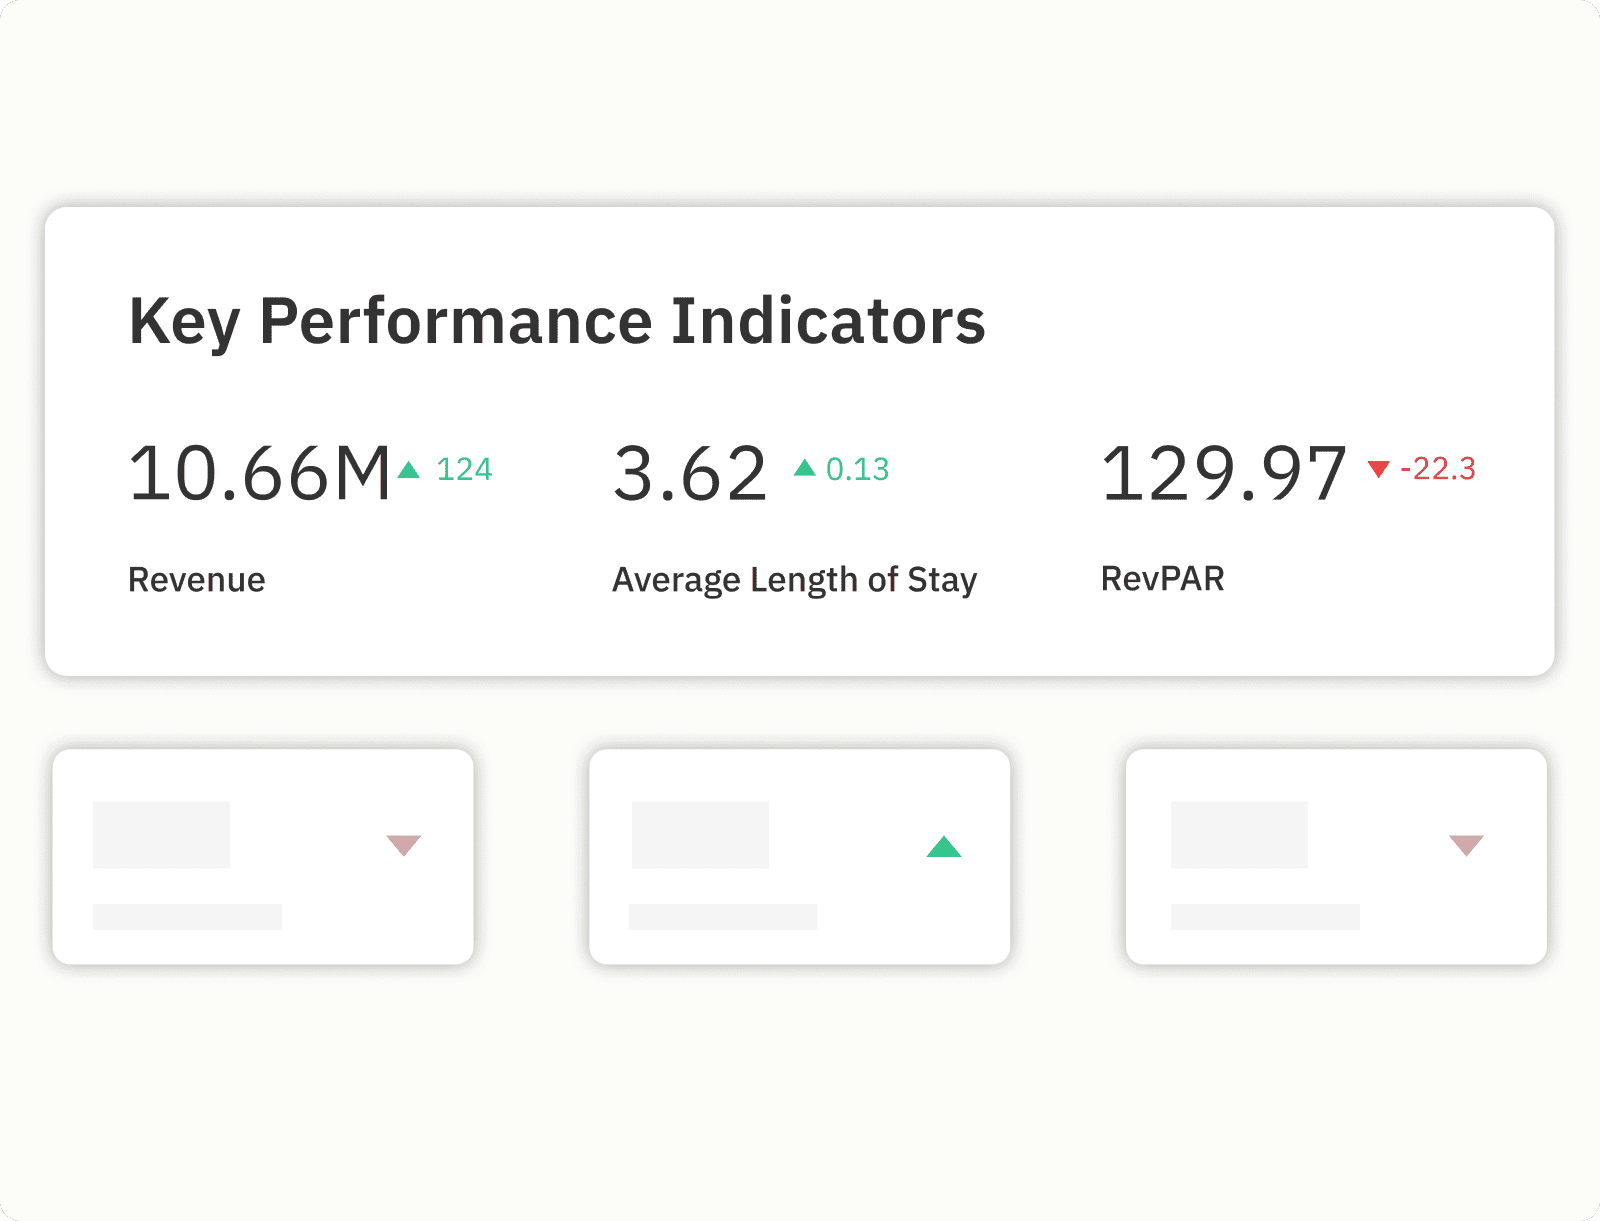
The KPI section is also where short-term rental analytics for an area starts, because the dashboard tracks the area's STR booking data through graphs and insights. The table below defines six of the eight KPIs.
Length of stay is shown as a median to account for long-term stays. The dashboard uses medians in several places because a few outlier listings with extreme prices or very long bookings can distort an average.
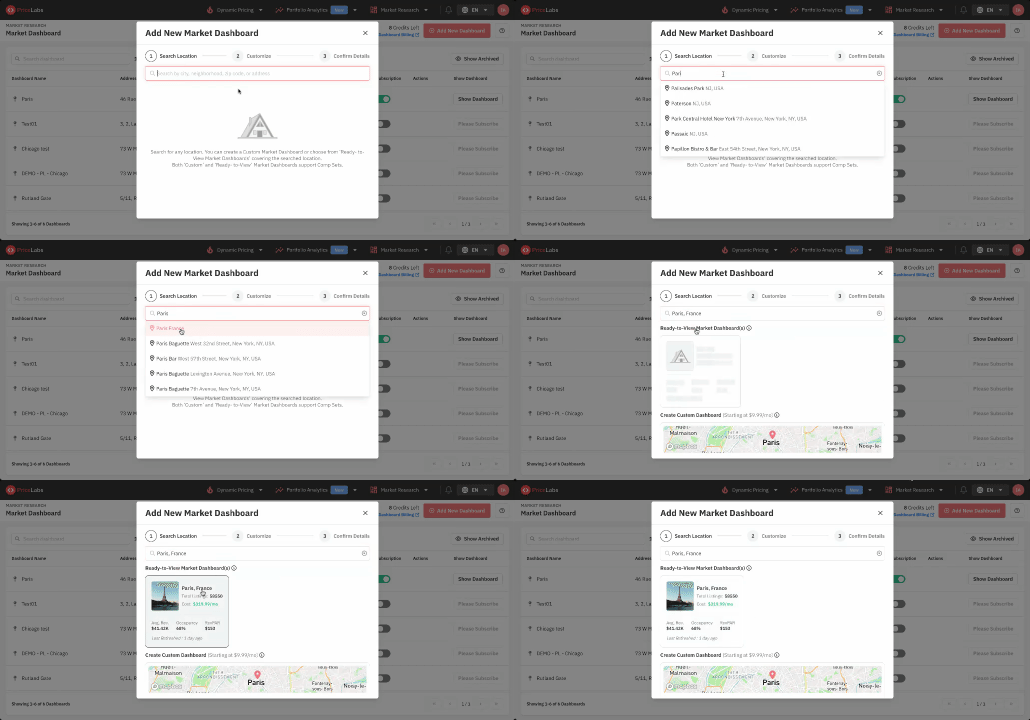
To create a dashboard, open the Market Dashboard page, click Add New Dashboard, enter an address or region and select it from the search dropdown. A search for an address also shows a Ready-to-View Market Dashboard when one exists for that location, and Ready-to-View dashboards are available for selected major cities.
A Custom Market Dashboard includes the nearest listings up to the size of the chosen plan, which is 1,000, 5,000 or 10,000 listings. A custom area can also be drawn with the polygon or circle tools to target a specific region.
The address or region cannot be changed after the dashboard is created, so it needs checking before creation. The currency also cannot be changed after creation. Once both are confirmed, enter a dashboard name and click Create Market Dashboard.
A comp set is a group of listings that potential guests compare against your listing when choosing where to book. In the Create Comp Set tab, listings can be filtered by drawing a polygon on the map, by using the Filter Listings button, or by typing conditions into the first row of the listing table. The Filter Listings button offers criteria such as bedrooms, occupancy and revenue.
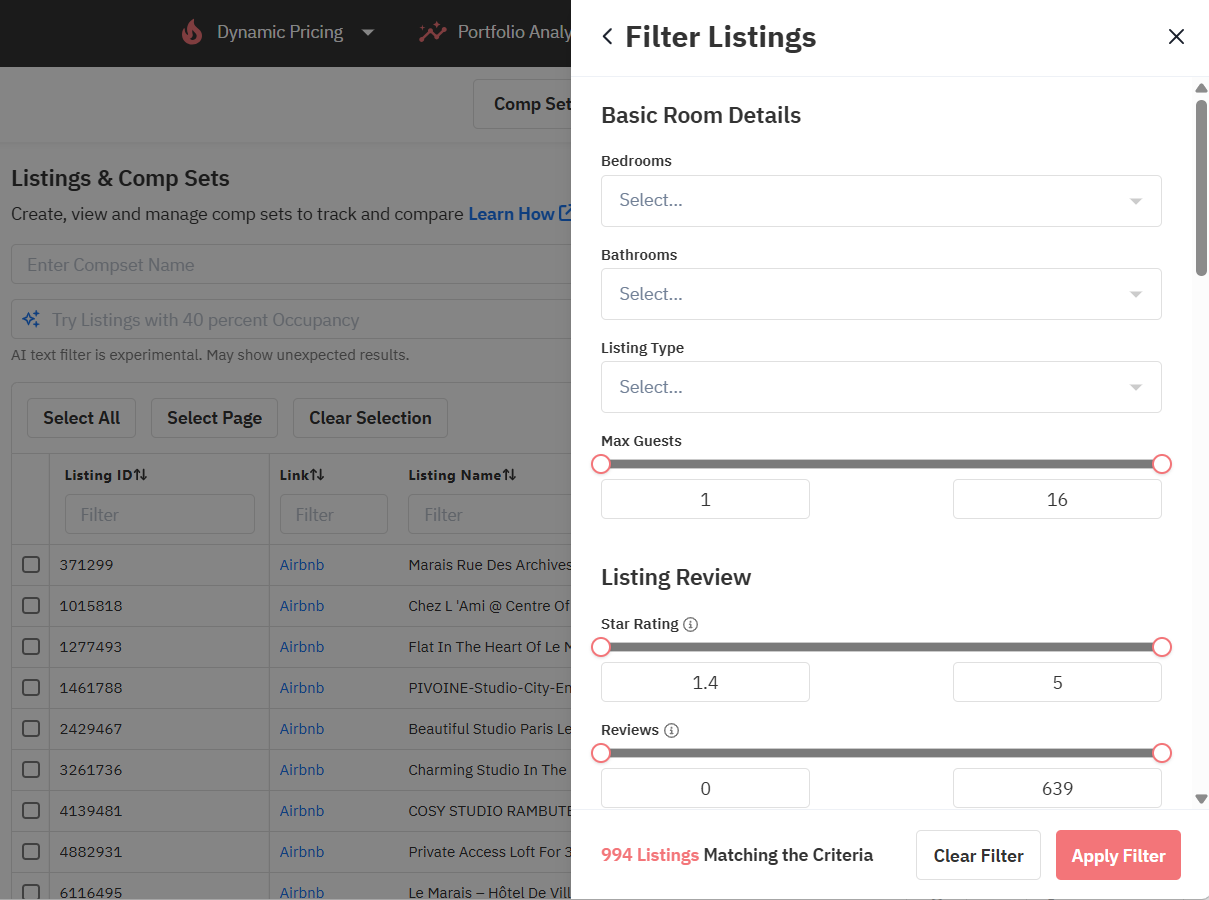
After listings are selected, name the comp set and click Generate Comp Set. A single dashboard can hold multiple comp sets.
Estimated Revenue in the listing table reflects the past 365 days. A revenue cell turns orange when the listing was created within the past 365 days, which means the figure covers only part of the year. Selecting a comp set from the Comp Set dropdown at the top of the dashboard refreshes every graph and chart to show only that comp set.
The Benchmark Against Comp Sets section places RevPAR, occupancy and ADR side by side with your comp sets. The KPI period can be set to the past 7, 30 or 365 days. Each KPI appears next to the previous period of the same length, which gives an at-a-glance view of market trends.
Projected revenue equals ADR multiplied by occupancy multiplied by available nights. Available nights are the nights a listing is open to reservations. Dashboard revenue estimates exclude cleaning fees and extra guest fees.
A hypothetical comp set with 68% occupancy and a $210 ADR has a RevPAR of $142.80. A hypothetical listing open for 365 nights with 35 nights blocked for owner stays has 330 available nights. A hypothetical listing with a RevPAR of $142.80 and 330 available nights projects to $47,124 in annual revenue. The 68% occupancy, $210 ADR and 35 blocked nights in this example are illustrative figures and do not come from a real market.
For detailed investment and revenue estimation, we also offer Revenue Estimator Pro, which provides instant revenue estimates based on similar listings.
The Market History charts show average revenue, RevPAR, ADR, occupancy, booking window and length of stay by month, for the whole market or by bedroom category. Revenue for a stay that spans several months counts toward the month of check-in. The guided research template points to the Historical Performance and Supply & Demand sections for spotting trends and seasonal shifts.
Key Future Dates highlights dates with higher occupancy than the dates around them, which can show emerging high-demand periods for adjusting pricing and stay requirements. The Future Occupancy chart shows occupancy, pickup and cancellations for upcoming dates, along with occupancy for the same dates last year. The Future Prices chart shows how property managers are pricing future dates. The Median Booked Price line on the Future Prices chart is an estimate and stays hidden until its box is ticked.
The Booking Curve section shows how market revenue, occupancy, ADR and RevPAR build in the days before a stay date. Booking curves are available when viewing full months or a group of months. The Compare with Last Year option overlays the same months from the previous year.
The Length of Stay and Booking Window charts show how far in advance guests book and how long they stay, so minimum stay settings can be aligned with those patterns. The Day of the Week charts show average occupancy and base prices for each day of the week over the past 30 days.
The Download as PDF option exports the dashboard with all active filters, chart customizations and date ranges. The PDF supports custom logos, color schemes and name cards, and a download panel lets sections be selected and notes added to each one. A PDF can be shared with a team or with property owners.
Data from individual sections can be exported as a CSV file using the pink square in the upper right corner of each module. Underlying booking data cannot be exported. Email updates about developing trends can be turned on from the Actions column, with a choice of day.
Market Dashboards use scraped data from Airbnb and Vrbo. For each listing, the data gathered is the information visible on its public Airbnb or Vrbo page, including the calendar and listing details. We build a history for each listing by recording how its calendar and prices change over time.
Booking window, length of stay, booked date and booked price are inferred from calendar changes. The booked price is assigned from the last listed price seen before the dates became unavailable. A date that becomes unavailable could be a booking or a block set by the owner, and no method can separate the two with certainty.
Our block removal logic looks at length of stay, booking window, market occupancy, extreme price variations and more. We automatically remove any stay longer than 60 days, because such stays do not fall under the short-term rental category. Block removal is not perfect, so a listing with unusually high occupancy in a weak market may include blocks that were counted as bookings. Suspicious cases can be sent to us so that we can improve the logic.
Bookings made on other channels still appear in the data when the property is also listed on Airbnb, because those bookings block the Airbnb calendar.
Multiply a comp set's ADR by its occupancy and by the number of nights your listing is available. ADR multiplied by occupancy equals RevPAR, so RevPAR multiplied by available nights returns the same result.
The data comes from publicly available Airbnb and Vrbo listing data, including each listing's calendar, prices and listing details. The data refreshes daily as long as the refresh switch is on.
Occupancy and revenue figures are estimates. We calculate them by monitoring listing calendars and applying block removal logic, and no block removal method is perfect.
Yes. Market Dashboards estimate revenue, ADR and occupancy to evaluate market viability and potential investments. Listings can also be filtered by bedroom count, and the selection applies to all sections of the dashboard.
Yes. Revenue Estimator Pro provides instant revenue estimation based on similar listings, with charts for yearly revenue, ADR and occupancy. The estimates use historical data from the past year and scraped Airbnb data.
A Market Dashboard is a separate product from Dynamic Pricing and has its own charge. Each dashboard costs $9.99 per month for up to 1,000 listings, $19.99 for up to 5,000 listings and $39.99 for up to 10,000 listings. New accounts with listings imported into PriceLabs receive one free dashboard.
Want to learn what PriceLabs can do for you? See for yourself with a free trial. Get started now!