Get started with PriceLabs now!
Want to learn what PriceLabs can do for you? See for yourself with a free trial. Get started now!
Understanding the most important vacation rental KPIs is critical for hosts and property managers aiming to maximize profitability and operational efficiency. These key performance indicators provide a clear snapshot of how your vacation rental business is doing, from occupancy levels to pricing effectiveness. By closely monitoring these metrics, alongside the dynamic pricing strategy they're meant to inform, you can make decisions that enhance revenue and optimize your rental portfolio across Airbnb, Vrbo, and direct booking channels.
In 2026, the short-term rental market remains highly competitive and dynamic. Having precise insights into your performance, and how it compares with similar listings, allows you to respond to seasonal swings, special events, and market shifts quickly and smartly.
Vacation rental metrics are not just numbers; they tell the story of your property's success and opportunities. By tracking KPIs such as occupancy and average daily rate (ADR), you can:
Without a systematic approach to measuring these KPIs and acting on insights, you risk undervaluing your property or missing out on maximizing bookings during peak demand. To start off strong, make sure your reporting is accurate, consistent, and leverages real-time market data where possible.
Revenue is the total income generated from bookings over a period (daily, monthly, or yearly). It's the foundational metric that reflects your business's cash inflow and directly impacts profitability. Tracking revenue trends helps you assess if your pricing and marketing strategies are effective.
Occupancy rate represents the percentage of nights booked out of the total available nights during a specific timeframe. It measures how often your property is rented.
How to calculate occupancy rate:
Occupancy Rate = (Number of Nights Booked / Total Available Nights) × 100
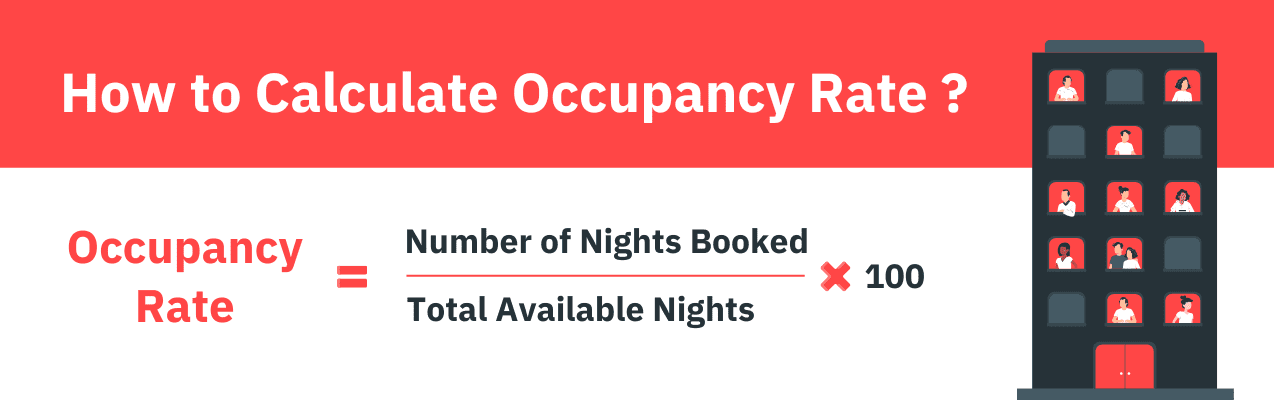
For example, if your rental was booked 18 nights out of 30 available, your occupancy rate is 60%. It's important to adjust "available nights" by excluding any blocked dates for maintenance or owner use.
Why occupancy rates matter: High occupancy generally means strong demand, but extremely high rates could signal underpricing or excessive wear on your property. Balancing occupancy with other KPIs like ADR is key.
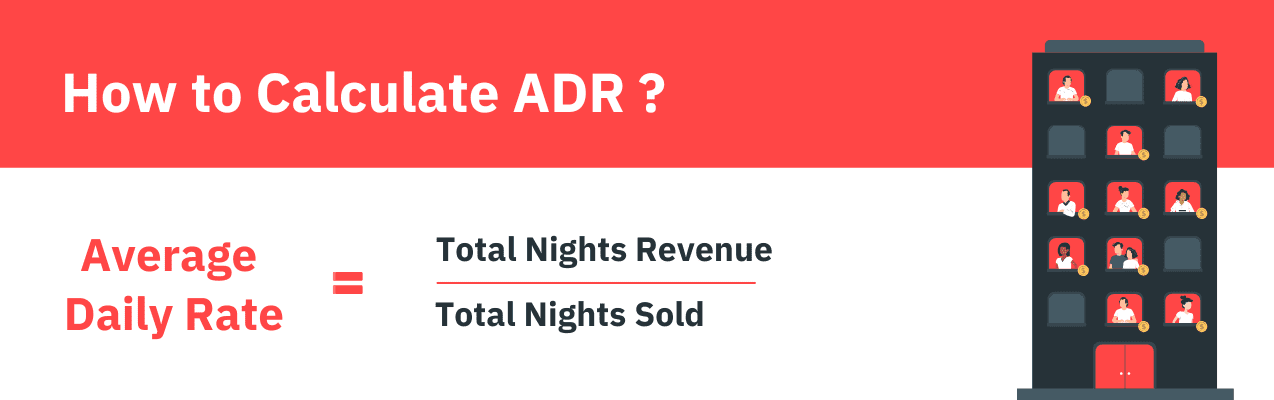
The ADR indicates the average price you receive per rented night. It accounts for variations in nightly prices across reservations.
How to calculate ADR:
ADR = Total Revenue / Number of Nights Booked
For example, if your property earned $2,000 from 20 nights booked, your ADR is $100.
ADR fluctuates based on seasonality, special events, local market trends, and your pricing strategy. Monitoring ADR helps you understand guest willingness to pay and compare listing competitiveness.
RevPAR blends occupancy and ADR to provide a comprehensive measure of revenue productivity. It reflects how efficiently your property fills available nights at your average rate.
How to calculate RevPAR:
RevPAR = Occupancy Rate × ADR
or
RevPAR = Total Revenue / Total Available Nights
If your occupancy is 50% and ADR is $120, RevPAR is $60.
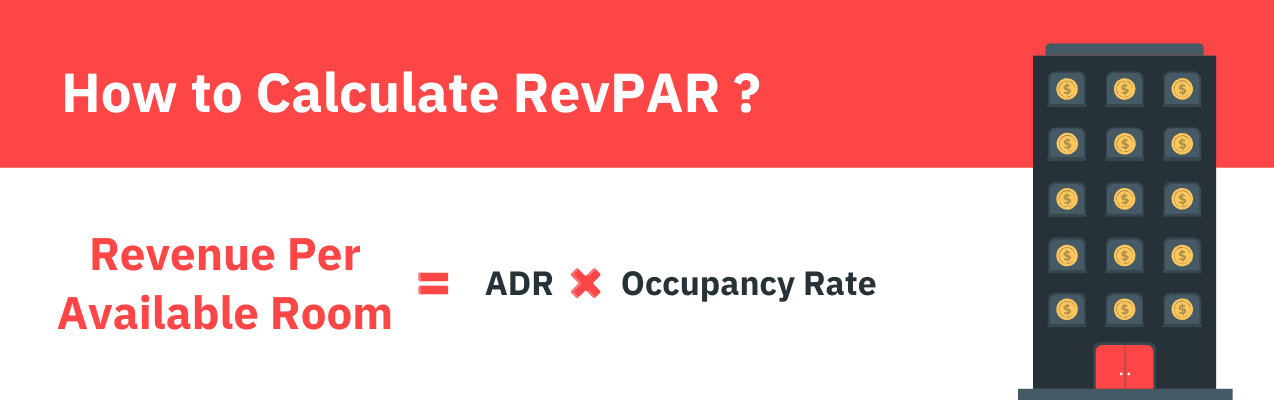
Why RevPAR is crucial: It shows whether your pricing is balanced with demand. A high ADR with low occupancy or vice versa might indicate issues that need addressing. RevPAR is widely used in revenue management to optimize profitability, though it stops at revenue and says nothing about your actual costs, our guide to profitability metrics beyond RevPAR covers the piece RevPAR alone misses.
ALOS measures the average number of nights guests stay at your property and has operational and financial impacts.
How to calculate ALOS:
ALOS = Total Booked Nights / Number of Bookings
For example, if six bookings total 18 nights, your ALOS is 3 nights.
Short stays can increase cleaning and turnover costs, while longer stays can decrease these costs and provide more predictable cash flow. Minimum stay rules, adjusted strategically, or a deliberate push toward mid-term stays, can help manage ALOS in either direction.
This is the average number of days between when a guest books and when they check in. Understanding booking lead times helps tailor marketing and pricing strategies.
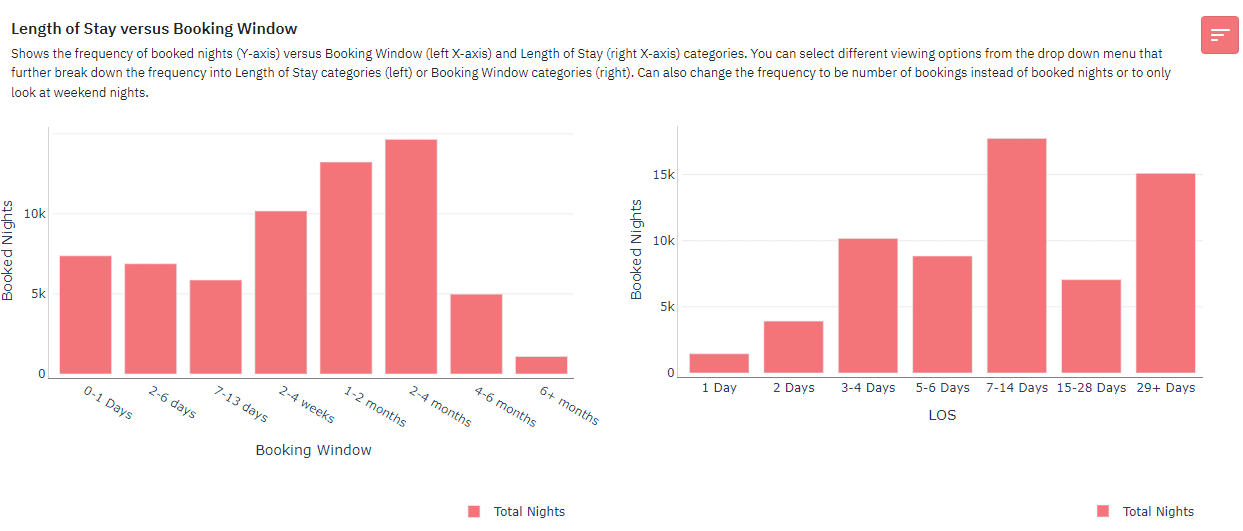
Why it's important: Certain destinations or seasons have longer booking windows, requiring early rate adjustments and targeted promotions. Short booking windows mean you may want to lean on last-minute pricing adjustments to fill vacancies efficiently.
Many property owners think 100% occupancy means maximum success.
However, chasing full booking every night has drawbacks:
For instance, raising your ADR slightly may lower occupancy a bit but can raise overall revenue, as shown by RevPAR improvements. This balance ensures you're not sacrificing profitability for volume.
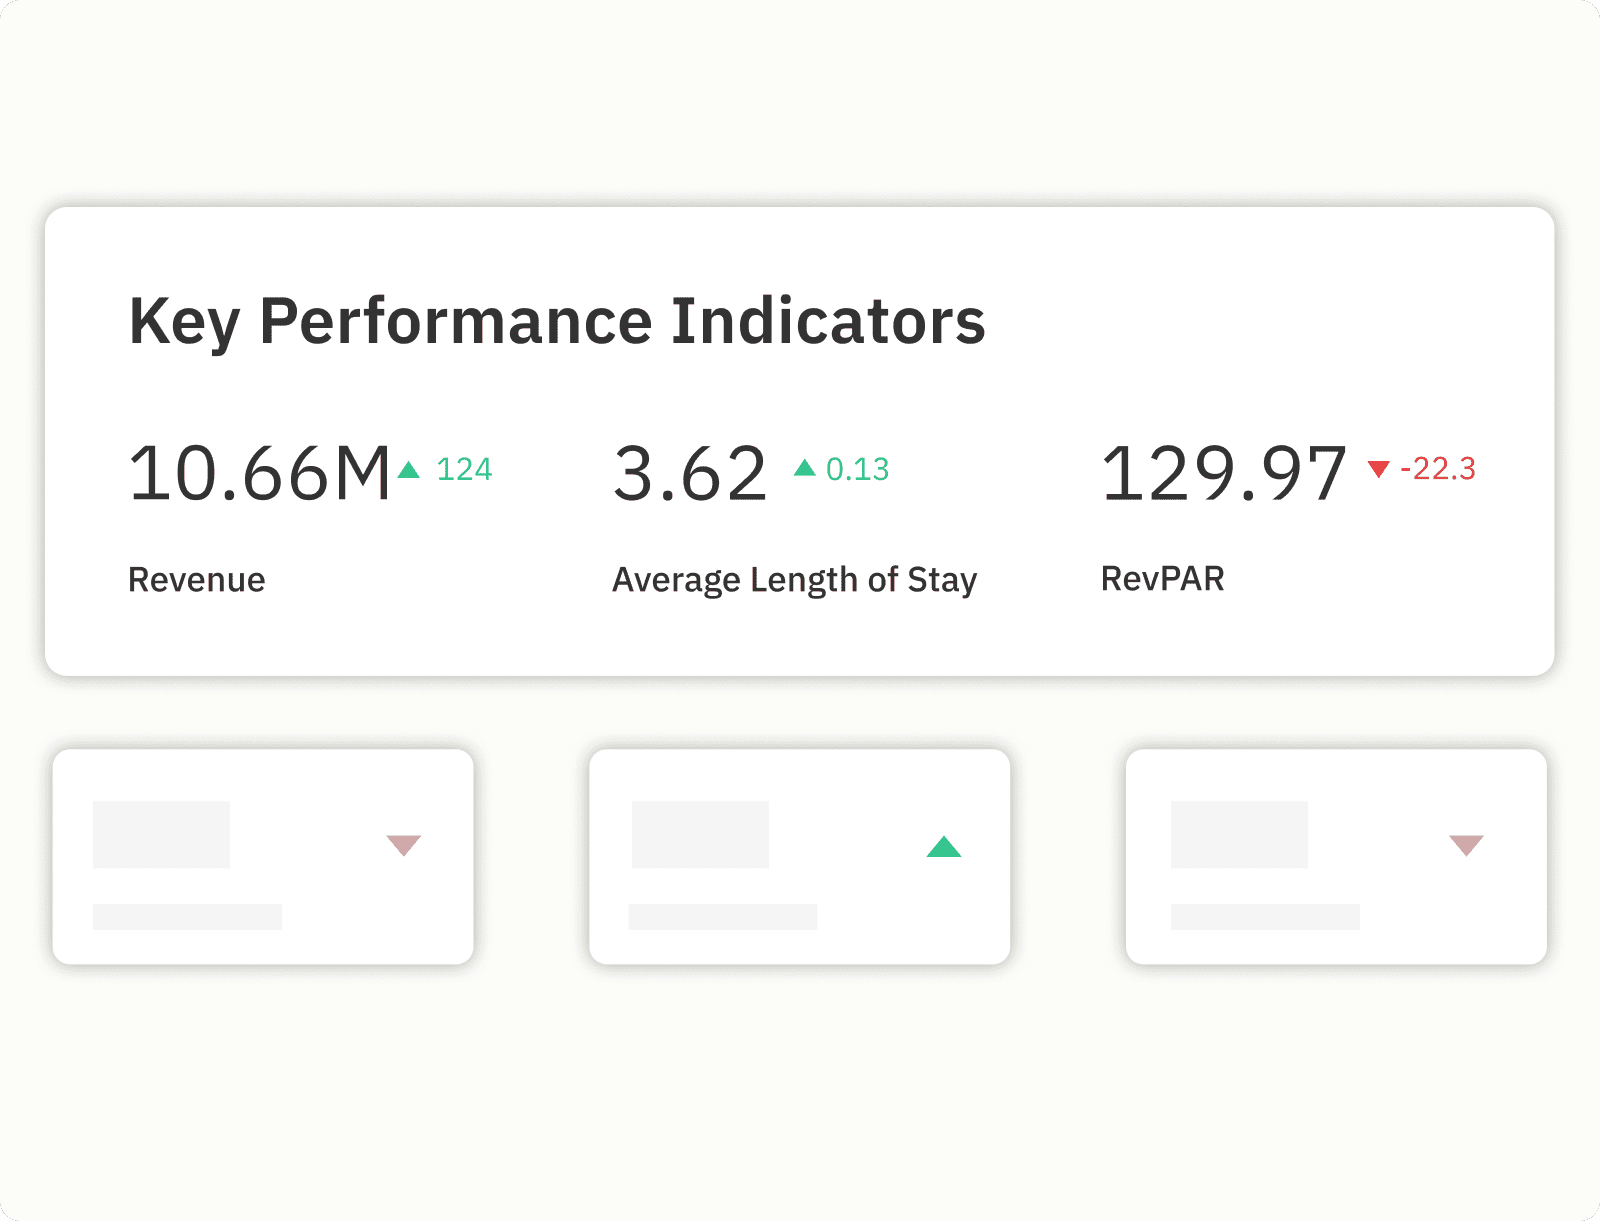
PriceLabs Portfolio Analytics offers a real-time, easy-to-understand dashboard tracking all critical vacation rental KPIs like occupancy rate, ADR, RevPAR, ALOS, and booking windows for each property and your entire portfolio.
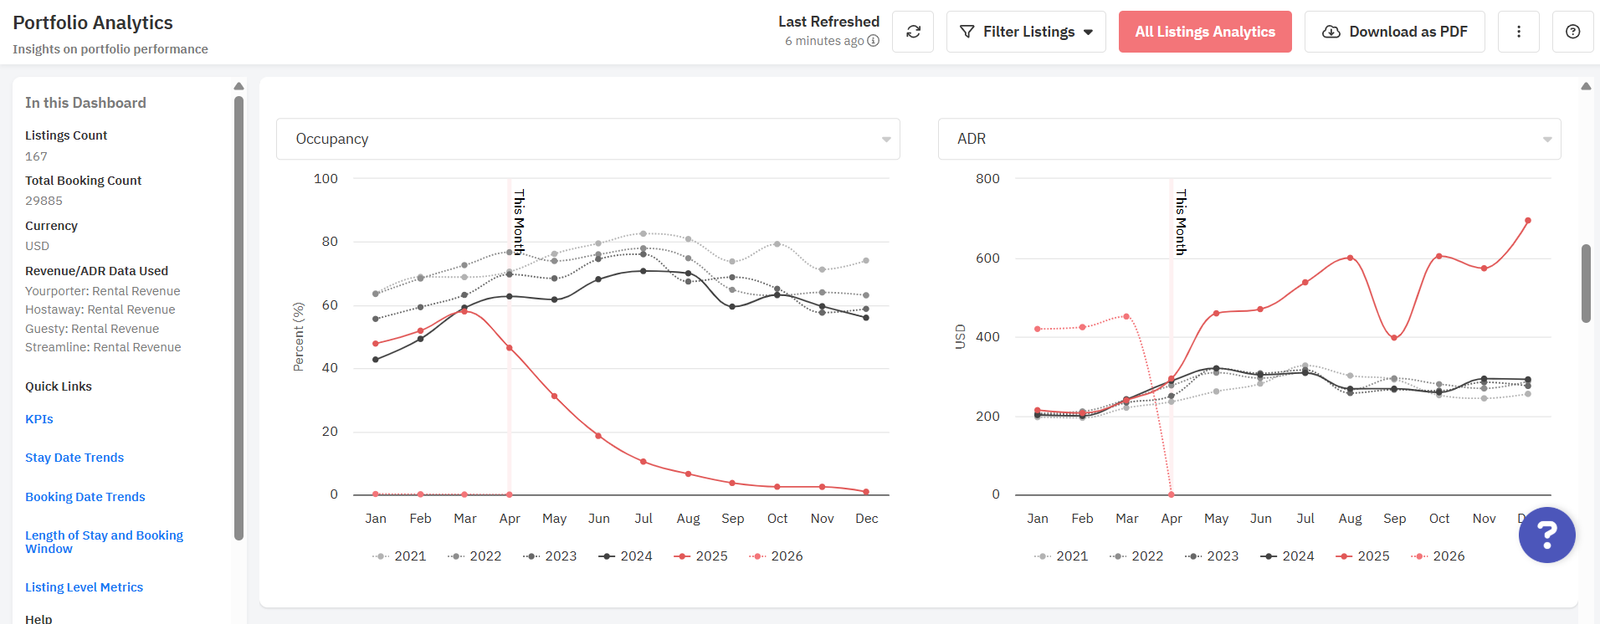
With Market Dashboards, you can compare your listings against neighborhood comp sets using over 40 filters to benchmark performance accurately.
PriceLabs' Dynamic Pricing solution uses the Hyper Local Pulse algorithm to automatically adjust nightly rates based on market demand, day of week, seasonality, and local events.

By integrating real-time pricing with KPI monitoring, using Portfolio Analytics to guide your pricing strategy, you can make smarter, data-driven decisions to optimize revenue without manual guesswork.
Additional features such as Dynamic Minimum Stay Rules help manage booking patterns and Date-Specific Overrides allow tactical adjustments for special occasions or orphan days.
Start building your data-driven pricing strategy today and avoid leaving money on the table.
Tracking these core vacation rental KPIs gives you a clear picture of your property's profitability and market position. Instead of guessing or reacting last minute, you can proactively manage pricing, occupancy, and guest stays with confidence. Once you know which metrics matter, the next step is making sure your base price is actually calibrated to what those metrics are telling you.
If you want a single source to monitor these metrics automatically, compare your listings with neighbors, and take immediate pricing action, tools like PriceLabs provide that operational edge.
If you'd rather build the habit of reviewing these numbers yourself first, this reporting checklist lays out exactly what to check and how often.
For turning these metrics into a forward-looking revenue plan rather than just a rearview mirror, see our guide to accurate revenue estimation with dynamic pricing.
While all KPIs matter, RevPAR is often the most telling indicator because it combines occupancy and pricing efficiency. It shows whether your rental is balancing high rates with good occupancy to maximize revenue.
Occupancy rate is the percentage of nights your property is booked out of total available nights. For example, if your rental is booked 18 nights out of 30 available, the occupancy rate is (18/30) × 100 = 60%.
ADR shows the average price paid per night for your property during booked nights. It helps assess if your pricing matches market demand and guest willingness to pay.
You can encourage longer stays by setting minimum night restrictions, offering discounts for extended bookings, or targeting mid-term renters. Tools that automate minimum stay rules can support this strategy effectively.
Although full booking sounds ideal, it can mean you are underpricing or overusing the property, leading to higher maintenance costs. Balancing occupancy and rate to maximize revenue and profit is usually more beneficial.
Want to learn what PriceLabs can do for you? See for yourself with a free trial. Get started now!