Get started with PriceLabs now!
Want to learn what PriceLabs can do for you? See for yourself with a free trial. Get started now!
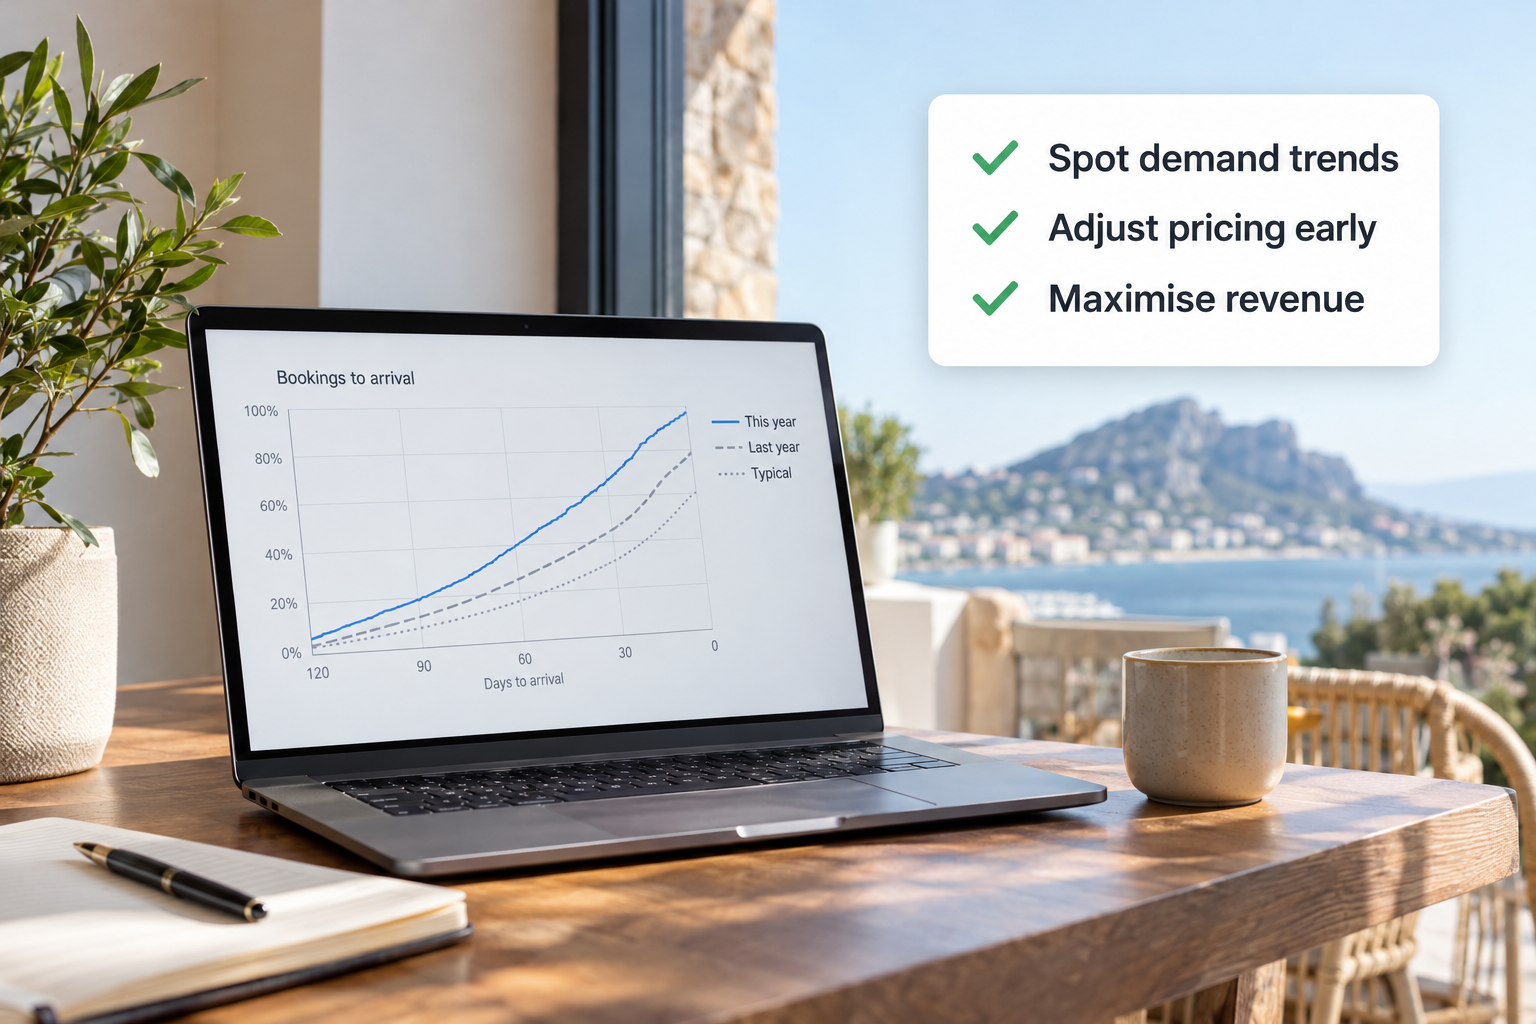
A booking curve plots how bookings, revenue, ADR and RevPAR build up for a stay date, from the day it opens for booking until the guest arrives. Read correctly, it shows whether performance is accelerating, stalling or arriving later than usual.
This is the reasoning Joana Coelho, a Solutions Consultant at PriceLabs who spent nine years managing revenue for hotel chains and boutique properties, uses to decide whether a rate needs to move.
Most revenue managers check one number: current occupancy, this month's ADR, today's RevPAR. A booking curve plots that number across the whole booking window, so you see how a date filled and not only where it landed.
Two listings can end at the same occupancy and still have different stories. One fills steadily from the day it opens, and the other sits empty for months and fills in the last two weeks. Those curves call for opposite pricing responses.
Pacing is a snapshot: how your current bookings compare with the same point last year, or with the market, right now. It is the fastest way to see whether you are ahead or behind.
A booking curve shows the pattern behind that snapshot: how bookings, revenue, ADR and RevPAR built up to reach today's position, compared with how they built up last year or in another period. Pacing tells you where you stand, and the curve tells you how you got there and whether the trend is still moving your way.
Used together, pacing flags that something is off and the curve shows when it started and how sharply, which helps you decide whether to act now or wait.
A few shapes recur often enough to recognize on sight. How to respond depends on the comparison, so check the market curve before you change a rate.
Bookings arrive well ahead of the stay date and fill quickly. This usually points to strong advance demand, event-driven interest or a market where guests plan early. Discounting early here can leave money on the table, so it is often worth holding or raising far-out rates.
Bookings arrive more slowly than in the same period last year or against comparable listings. Demand may have softened, but your pricing, minimum stay settings or listing visibility may also be working against you. Before cutting rates across the board, check whether the market curve is flat too. If competitors are pacing normally and you are not, the cause is more likely your listing than the market.
Bookings stay quiet for most of the window and then surge in the final two to three weeks, which is common in markets with a lot of last-minute or drive-to travel. Deep early discounts can train guests to wait, and they can underprice dates that would have sold at a higher last-minute rate anyway.
If occupancy climbs while ADR stays flat, there is usually room to raise price without losing pace. If ADR climbs while occupancy lags the market, the listing may be priced above what current demand supports, and easing off protects the booking pace instead of only the margin on the bookings you do get.
Booking curves and pacing are only as useful as the period you compare against. The same time last year is the usual default because it is the closest match for seasonality, weekday mix and typical demand.
That default breaks down when last year was not representative, such as after a market disruption, for a new listing with no track record, or after a one-off local event. In those cases, comparing against the market's curve for the same period, or blending a few prior years, gives a steadier read than anchoring to one unusual year.
Portfolio Analytics has three main report areas: KPIs and Historic Reports for past performance, Pacing Reports for forward-looking analysis, and Booking Curves, which show how bookings, revenue, occupancy, ADR and RevPAR build up over time.
Pacing reports can compare your future dates against yourself or against the market. Against yourself, they show forward-looking rates, occupancy, ADR and RevPAR next to the same day last year, and a Final last year option shows last year's final numbers. Against the market, they overlay your metrics on market metrics for the same dates.
You can choose a custom date range for a year-over-year comparison and compare against several prior years, which helps most where one prior year does not represent normal demand. Market Dashboards add the market side, including booking window and length of stay, so you can check whether a curve is specific to your listing or shows up across the whole market.
In some markets, PriceLabs also applies a pacing factor, which adjusts prices when projected demand deviates significantly from historical seasonal trends.
Booking curves are one input into vacation rental revenue management, and Portfolio Analytics keeps them next to your other KPIs.
It means bookings are arriving more slowly than they did over the same period in your comparison year. That can point to softer demand, but your rate, minimum stay settings or listing visibility may also be out of step with what guests want to book now. Check the market's curve for the same period before assuming demand has dropped.
Compare your occupancy and revenue for a future date range with the same period last year and with the market. Pacing ahead of both is a strong signal that you can hold or raise rates. Pacing behind your own history but in line with the market usually points to a market-wide shift rather than a listing problem.
If occupancy is outpacing ADR, there is usually room to raise price without slowing your pace. If ADR is outpacing occupancy relative to the market, the rate may be ahead of current demand, and a modest pullback protects the booking pace.
In Portfolio Analytics, under Pacing Reports and Booking Curves. You can compare against last year, several prior years or the market.
Want to learn what PriceLabs can do for you? See for yourself with a free trial. Get started now!