
Get started with PriceLabs now!
Want to learn what PriceLabs can do for you? See for yourself with a free trial. Get started now!
Pushing harder for direct bookings feels like the obvious profitability lever, right up until you calculate what a direct booking actually costs to acquire and service. Vacation rental channel profitability metrics exist precisely because gross revenue and booking volume hide the real story. A channel that brings in fewer bookings at a better margin can outperform one that fills your calendar faster but eats itself alive in fees and overhead, the same gap that shows up in the KPIs worth tracking across a portfolio.
This guide covers the three metrics that actually show channel profitability, RevPAR, net ADR, and market share, and how to use them to decide where your effort and marketing spend should go. For the wider framing this sits inside, see the vacation rental revenue management guide.
Comparing channels on booking volume or gross revenue alone consistently misleads. A channel that books your calendar solid at a discounted rate can generate less actual profit than one with fewer, higher-value bookings and lower servicing costs. Every channel carries a different cost structure, whether that is a commission percentage, payment processing fees, or the marketing spend required to keep the channel producing. Reading occupancy against ADR is the first step toward the same discipline applied here at the channel level rather than the portfolio level.
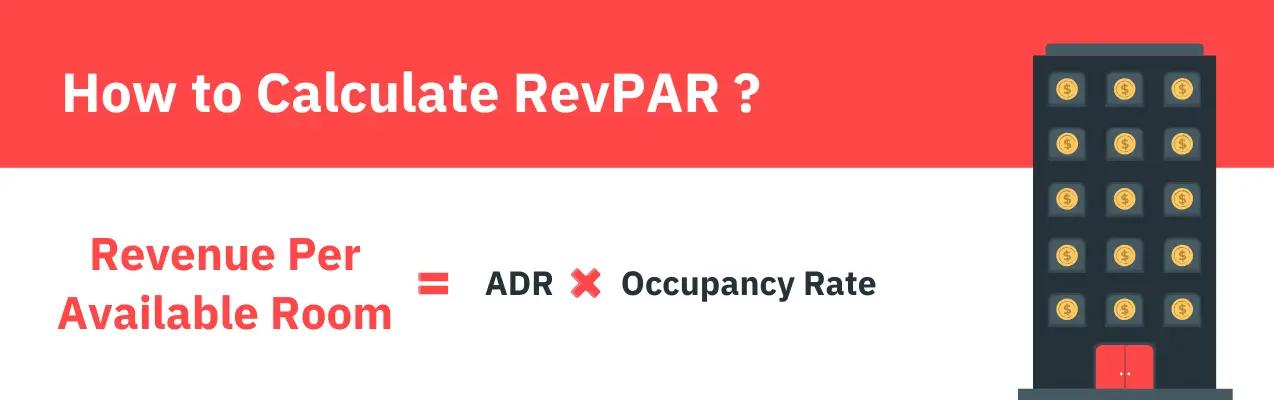
RevPAR, revenue per available rental, measures how much revenue a channel generates per unit of inventory, factoring in occupancy alongside rate. It is calculated as occupancy rate multiplied by average daily rate, or equivalently, total revenue divided by available rental nights. RevPAR explained in depth covers the calculation if this is new to your reporting.
Tracking RevPAR separately for each channel matters because a high rate channel with weak occupancy can lose to a moderately priced channel that fills consistently. A channel showing strong ADR but declining RevPAR over several months is quietly losing occupancy, and that gap only shows up when the two numbers are tracked side by side rather than looked at individually, the same discipline covered in pacing reports.
Gross ADR is the number most operators track, and it is also the one most likely to overstate profitability, because it ignores everything a booking actually costs to service. Net ADR corrects for that by subtracting channel commissions, transaction fees, and direct costs like cleaning from the gross rate, then dividing by nights booked, the same cost discipline behind property management KPIs generally.
The formula is straightforward: gross rate minus channel and transaction fees minus direct costs, divided by nights. Direct bookings often show a higher net ADR than OTA bookings because they skip the commission, but that gain is not automatic. It only holds if the marketing and operational cost of running direct bookings does not eat back into the margin the commission saved you. The KPIs worth tracking alongside net ADR are the same ones that catch a direct channel quietly becoming more expensive to run than it looks.
Market share tells you how your channel mix compares to what the broader market in your area is doing, which gives context that your own numbers alone cannot. If Airbnb bookings are climbing sharply as a share of the local market, that is a signal worth responding to, whether by adjusting your own listing presence there or by watching whether it changes your competitive position on other channels. A channel losing share locally may be worth deprioritizing even if your individual listings are still performing acceptably on it, a call best made alongside the advanced tools built for revenue managers.
Monitoring competitor pricing and positioning across channels is where this context comes from in practice, and it is worth checking regularly rather than only when a channel's performance already looks off.
Direct bookings avoid OTA commissions, which makes the appeal obvious, but the full cost picture is more complicated than commission avoidance alone. Running a direct booking channel means absorbing the cost of a booking website, payment processing, guest communication, and ongoing marketing spend on SEO or paid channels to keep traffic coming in. Direct channels also tend to have lower impressions than the major OTAs, which can mean slower fill rates and more unsold inventory if demand does not show up as reliably, the exact risk slow season occupancy tactics are built to manage.
Rate parity is another quiet cost. Without Dynamic Pricing keeping rates consistent across channels, a direct rate can end up accidentally undercut by an OTA listing for the same dates, which defeats the purpose of building the direct channel at all. This is exactly why comparing net ADR and RevPAR by channel matters more than simply maximizing the direct booking share as a percentage.
Start by exporting your own booking, pricing, occupancy, and revenue data segmented by channel and timeframe. The report builder handles this segmentation without manual spreadsheet work, and it is the baseline everything else in this process depends on.
From there, bring in external market context using third party market intelligence platforms to compare your ADR, RevPAR, and occupancy by channel against local market averages, and to track how market share is shifting across channels in your area. Calculate net ADR, RevPAR, profit margin, and market share per channel using the combined internal and external view, and build a simple dashboard or table that puts your highest and lowest performing channels side by side. Portfolio Analytics is the tool for the internal half of this comparison across your properties.
Once the numbers are in front of you, reallocate effort toward the channels with the best net profitability rather than the highest booking volume, even where that means pulling marketing spend or renegotiating terms with an underperforming channel, a decision easier to defend to an owner using data rather than instinct. Review the comparison monthly for pricing and mix decisions, and do a deeper quarterly pass aligned with seasonality shifts.
| Cost category | What it includes | Why it is easy to miss |
|---|---|---|
| Channel commissions and fees | OTA commissions, listing fees, payment processing charges | Often quoted as a flat percentage but varies by channel and booking type |
| Cleaning and turnover | Variable per-stay costs tied directly to guest turnover | Scales with booking frequency, not just revenue |
| Maintenance and supplies | Consumables, toiletries, linens, utilities per stay | Rarely tracked per channel even though it should be |
| Marketing and advertising | SEO, paid ads, and promotion spend attributable to a channel | Direct bookings carry this cost where OTAs largely do not |
| Operational overhead | Guest support, payment handling, booking management time | Time cost rarely gets converted into a dollar figure |
The most frequent mistake is looking only at gross ADR, which inflates perceived profitability by ignoring the costs sitting underneath it. A close second is lumping all channels together in reporting, which hides which specific channel is actually driving margin versus volume. Fine tuning your revenue strategy depends on catching both of these before they distort a channel mix decision.
A third mistake is reviewing this only occasionally, sometimes not until a slow quarter forces the question. Channel dynamics shift with seasonality, new entrants, and local regulation changes, and a quarterly-only review misses drift that shows up gradually rather than all at once. Pacing reports make a lighter monthly check practical without turning this into a full audit every time.

A profitability comparison that lives in a spreadsheet nobody opens does not change decisions. Dashboards that track RevPAR, net ADR, and occupancy by channel in one place, alongside simple bar charts or waterfall views showing how gross revenue turns into net profit per channel, make the pattern visible at a glance rather than buried in a table. Portfolio Analytics dashboards are built for exactly this kind of at-a-glance comparison across properties and channels.
RevPAR is revenue per available rental, calculated as occupancy rate multiplied by ADR, and tracking it by channel shows which channels actually maximize revenue for your inventory rather than just filling it. A channel can show strong ADR but weak RevPAR if occupancy is quietly declining, a gap that gross revenue alone will not reveal, which is why reading occupancy against ADR together matters.
Regular ADR is the gross nightly rate, while net ADR subtracts channel commissions, transaction fees, and direct costs like cleaning to show what a booking actually nets after expenses. Direct bookings often show a higher net ADR than OTA bookings, but only once the marketing and operational cost of running that channel, tracked through the report builder, is properly accounted for.
Not automatically. Direct bookings avoid OTA commissions, but they carry their own costs in website upkeep, payment processing, marketing spend, and potentially lower fill rates from reduced visibility. Comparing net ADR and RevPAR by channel, rather than assuming direct bookings are inherently more profitable, is what actually confirms the gain, using the same view as Portfolio Analytics.
Monthly for pricing and channel mix decisions, with a deeper quarterly review aligned to seasonal shifts. Reviewing only occasionally lets channel drift accumulate for months before it shows up clearly in the numbers, the same drift fine tuning your strategy regularly is meant to catch.
Channel commissions and transaction fees, cleaning and turnover costs, maintenance and consumables, marketing spend attributable to that channel, and operational overhead like guest support and booking management. Skipping any of these, especially the marketing cost tied to direct bookings, is the most common way net ADR calculations end up overstating true profitability.
Channel-level metrics build on the fundamentals in our RevPAR calculation walkthrough, and fit into the broader revenue management picture covered in our complete guide to vacation rental revenue management.
Want to learn what PriceLabs can do for you? See for yourself with a free trial. Get started now!