Get started with PriceLabs now!
Want to learn what PriceLabs can do for you? See for yourself with a free trial. Get started now!
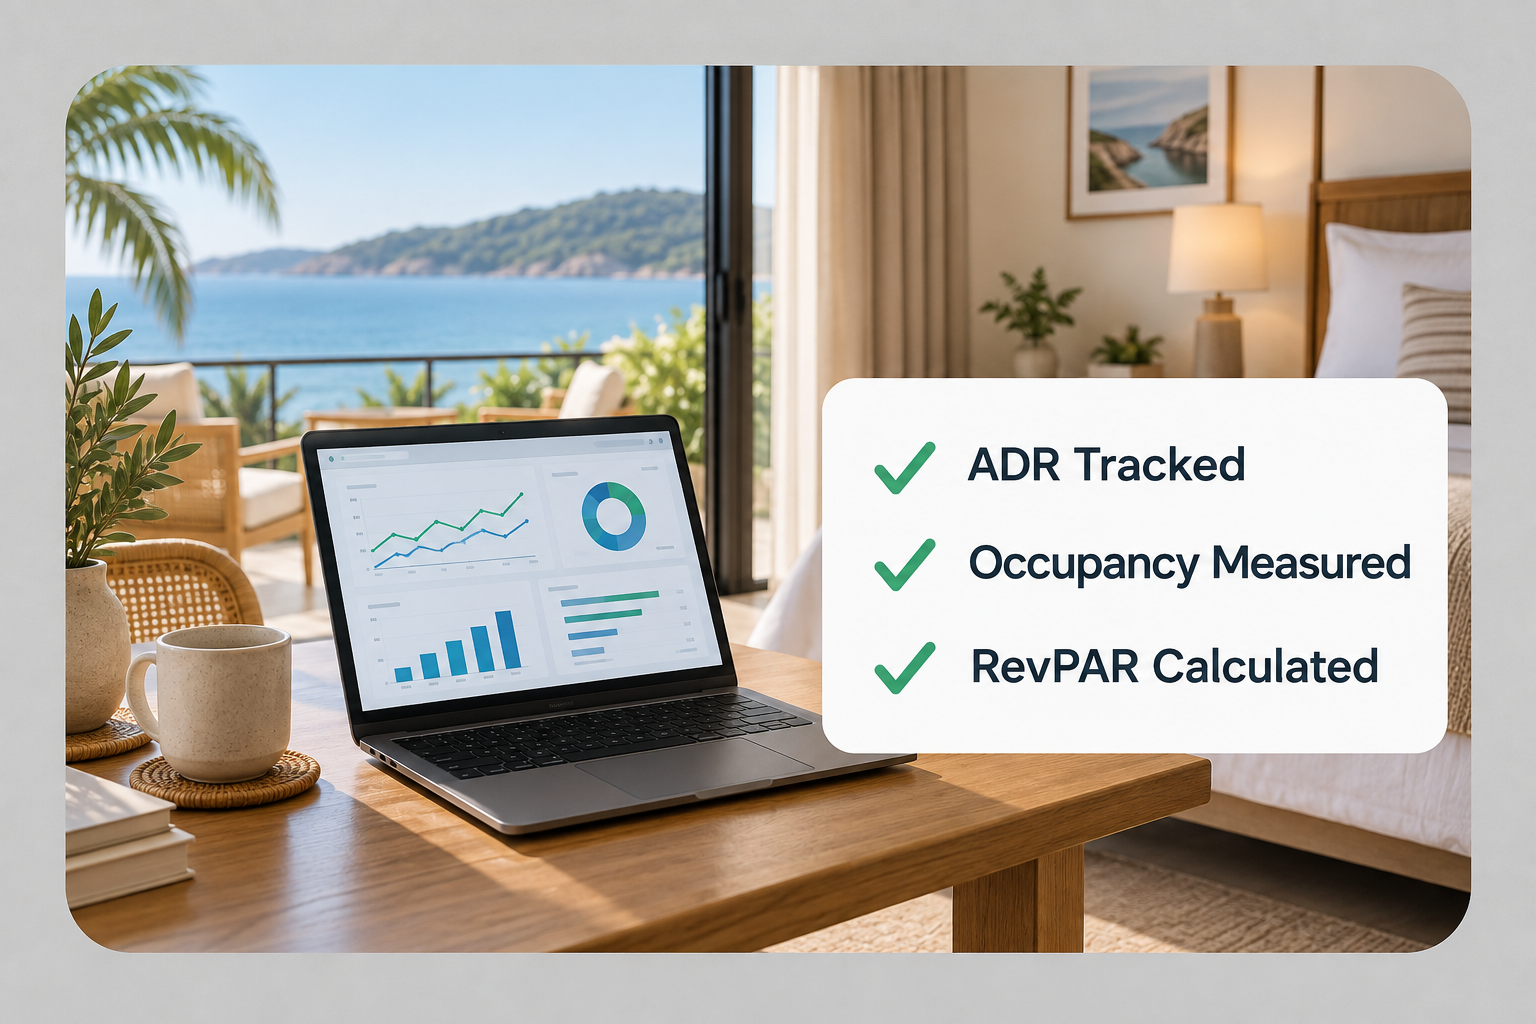
RevPAR, or Revenue per Available Room, is a key performance metric used by vacation rental hosts and property managers to measure how effectively they are generating revenue from their available rental inventory. Knowing how to calculate RevPAR, alongside the other vacation rental KPIs that feed into your pricing strategy, helps you assess both your pricing and occupancy management, enabling smarter revenue decisions. This guide explains what RevPAR is, how to compute it with clear examples, compares RevPAR vs ADR (Average Daily Rate), and offers practical tips to improve your RevPAR and overall rental revenue.
RevPAR (Revenue per Available Room) calculates the average revenue earned per available rental night, whether booked or not, over a given time period. Unlike ADR, which only looks at average rent for nights booked, RevPAR accounts for both your nightly rate and your occupancy rate. This combined view gives you a clearer picture of your property's revenue-generating efficiency, and it's the kind of question a revenue manager is specifically tasked with answering.
For vacation rental hosts managing multiple listings on Airbnb, Vrbo, or direct channels, monitoring RevPAR helps you:
While RevPAR reflects revenue inflow, it doesn't touch what that revenue actually costs to earn. Two listings can post identical RevPAR and still land at very different profit if one carries higher cleaning costs, utilities, or platform fees eating into that top line. TrevPAR and ARPAR close part of that gap by weighing cost per occupied rental against revenue rather than tracking revenue alone. RevPAR still remains a foundational KPI for spotting demand and pricing issues, even though balancing pricing against margin across a whole portfolio eventually takes more than RevPAR alone can tell you.
There are two standard approaches for calculating RevPAR:
RevPAR = Total Room Revenue ÷ Total Number of Available Nights
Total room revenue excludes taxes, cleaning fees, and other miscellaneous charges, focusing only on the rent collected for booked nights. Available nights represent the total rental nights available for booking, excluding any maintenance or owner blocks.
Example: If your property earned $10,000 in rental revenue over 100 available nights, your RevPAR = $10,000 ÷ 100 = $100.
RevPAR = Average Daily Rate (ADR) × Occupancy Rate
ADR is the average rental price per booked night, and occupancy rate is the percentage of available nights actually booked.
Example: With an ADR of $150 and 75% occupancy, RevPAR = $150 × 75% = $112.50.
This formula is widely used because it highlights the balance between pricing and occupancy in driving revenue.
Note: Both formulas yield the same RevPAR when calculations use aligned data.
Imagine managing a portfolio of 50 vacation rental units.
Calculating RevPAR:
RevPAR = $150 × 80% = $120 per available rental per night.
To find monthly RevPAR, multiply daily RevPAR by the number of days in the month. For quarterly or annual calculations, multiply accordingly.
By monitoring RevPAR alongside ADR and occupancy, you can identify if pricing or occupancy adjustments are needed. For example, if RevPAR drops below your ADR, increasing occupancy or adjusting rates could be necessary to boost revenue.
ADR (Average Daily Rate) is the average rental price per booked night, ignoring unbooked nights.
RevPAR considers all available nights, booked or not, combining occupancy with ADR.
Since RevPAR accounts for occupancy, it is typically lower than ADR unless you achieve 100% occupancy, and treating a rate cut and an occupancy gain as interchangeable is where the ADR vs occupancy trade-off usually gets misjudged: the two rarely move revenue by the same amount for the same size of change.
ADR equals RevPAR only when your occupancy rate is 100%. In this scenario, every available night has been booked, so all available inventory earns revenue.
But hitting full occupancy is rare and can increase maintenance and cleaning costs. Also, pricing too low to ensure full bookings may hurt long-term revenue. The goal is balancing ADR and occupancy effectively to maximize RevPAR and total revenue.
Assume 100 available nights.
Scenario A:
Scenario B: Increase ADR by $20, occupancy dips to 75%
This higher ADR and slightly lower occupancy generate $4,106 more annually, showing the power of finding the right pricing-occupancy mix. Scale that trade-off across a whole portfolio, where balancing ADR, occupancy, and margin across a portfolio gets meaningfully harder, and the stakes get bigger too.
The RevPAR Index compares your property's RevPAR against a competitive set of similar rentals. It helps you understand your market position and pricing effectiveness.
RevPAR Index = (Your RevPAR ÷ Average RevPAR of Competitors) × 100
Choose competitors with similar location, size, amenities, and price range to get meaningful benchmarking insights. This helps you identify whether pricing, occupancy, or property features need adjustments. Doing this manually across a portfolio gets tedious fast, Portfolio Analytics tracks these metrics for you in real time, and pairing it with Market Dashboards lets you build the comp set this index actually depends on. If you want the step-by-step on using that data in your own pricing strategy, that's covered in depth separately.
While RevPAR is valuable, it has limitations, especially for vacation rentals where additional revenue streams and variable costs matter. Here are other metrics to consider, part of the broader set of vacation rental revenue metrics worth tracking alongside RevPAR:
Tracking all three alongside RevPAR is easy to overdo: more dashboards don't automatically mean better decisions, and knowing which revenue metrics actually deserve your attention matters more than monitoring everything available.
Increasing RevPAR usually rewards small, deliberate rate moves over sweeping ones, a 5% ADR increase that costs you two points of occupancy is often still a net win, the kind of trade-off Airbnb revenue management strategies are built around testing systematically rather than guessing at. Here are practical ways to improve RevPAR specifically:
None of this works as a one-time fix, it only pays off as data-driven vacation rental management, an ongoing habit rather than a quarterly scramble.
PriceLabs Dynamic Pricing uses the Hyper Local Pulse algorithm to set optimal daily rates that balance occupancy and nightly prices for maximum RevPAR. Features like Real-Time Sync update prices across platforms daily, while Minimum Stay Rules and Date-Specific Overrides fine-tune availability and rates. With Market Dashboards and Portfolio Analytics, you can benchmark and track RevPAR trends and adjust your strategy effectively.
Managing a whole book of properties rather than a single listing calls for property management KPIs at the portfolio level. And since RevPAR alone won't tell you whether Airbnb or a direct booking is actually the more profitable sale, channel profitability metrics break performance down by booking channel instead.
RevPAR stands for Revenue per Available Room and measures how much revenue each available rental night generates, considering both your rental price and occupancy rate.
Calculate RevPAR by multiplying your Average Daily Rate (ADR) by your occupancy rate. For example, if your ADR is $120 and occupancy is 70%, your RevPAR is $120 × 0.7 = $84.
ADR is the average price for nights booked, while RevPAR accounts for all available nights, combining pricing and occupancy to measure revenue efficiency.
Generally yes, as it indicates more revenue per available night. But it's important to balance with costs and occupancy to ensure profitability.
Absolutely. Monitoring RevPAR alongside occupancy and ADR helps you find the right pricing strategy to maximize your total revenue and avoid having empty nights.
By mastering how to calculate and improve RevPAR, you will be better equipped to make data-driven decisions that improve your rental income and grow your business over time.
Want to learn what PriceLabs can do for you? See for yourself with a free trial. Get started now!