Get started with PriceLabs now!
Want to learn what PriceLabs can do for you? See for yourself with a free trial. Get started now!

Your Colorado calendar was 80% booked this time last year. Today it sits at 40%, and nobody warned you. Reading vacation rental demand trends early is the difference between a controlled price adjustment in November and a panic discount in January. Most property managers spot the drop weeks after it started, once the pickup damage is already done. The demand signals were there the whole time, sitting in market data nobody was checking daily. This guide walks through the five signals that move first, what actually happened in three recent market swings, and how to adjust rates before the gap widens. If you manage 6 to 49 properties and answer to owners who want reasons, not hunches, the analytics guide pairs well with what follows.
Vacation rental demand trends are measurable shifts in how travelers search, book, and pay for short stays in a specific market. They show up as changes in booking pace, lead time, average daily rate, and occupancy across your comp set, not just your own listings. Tracking them weekly lets you reprice before competitors do, which protects both rate and occupancy. Managers who track performance against the market catch these moves earliest.
A demand trend is a directional change in market behavior over time. One slow weekend is noise. Vacation rental demand trends only count once the movement repeats. Four weeks of shrinking booking windows across your whole comp set is a trend, and it needs a pricing response. The comp set definition matters here, because the wrong comparison group produces the wrong signal.
Five demand signals carry most of the useful market data. Booking pace tells you how fast future dates are filling versus the same point last year. Lead time tells you how far ahead guests commit, and last minute pricing depends entirely on that number.
Average daily rate and occupancy move in opposite directions more often than managers expect, which is why the occupancy and ADR relationship deserves its own attention. Search volume rounds out the set, showing interest before it converts into bookings. Together these feed the management KPIs most owners eventually ask about.
Experienced managers develop good instincts, and instincts still fail in predictable ways when reading vacation rental demand trends. Your own portfolio is a sample of a few dozen listings in a market of thousands. That sample is too small to separate a real trend from a bad fortnight, which is what data science at market scale is for.
Instinct also lags. By the time a booking slowdown feels obvious on your calendar, the market shifted weeks earlier and competitors already repriced. Managers dealing with low bookings usually find the inflection point sat well behind them.
The third failure is narrowness. Demand rarely moves uniformly across a market. It shifts by bedroom count, by amenity, by neighborhood, and by exact date, and only granular competitor rate tracking surfaces that detail.
Vacation rental demand trends produce more market data than any manager can review. You do not need to watch everything. You need to watch the few things that move first, then act on them consistently. The table below sets out what each signal tells you and what a sensible first response looks like. Pair it with the revenue management guide for the fuller decision framework.
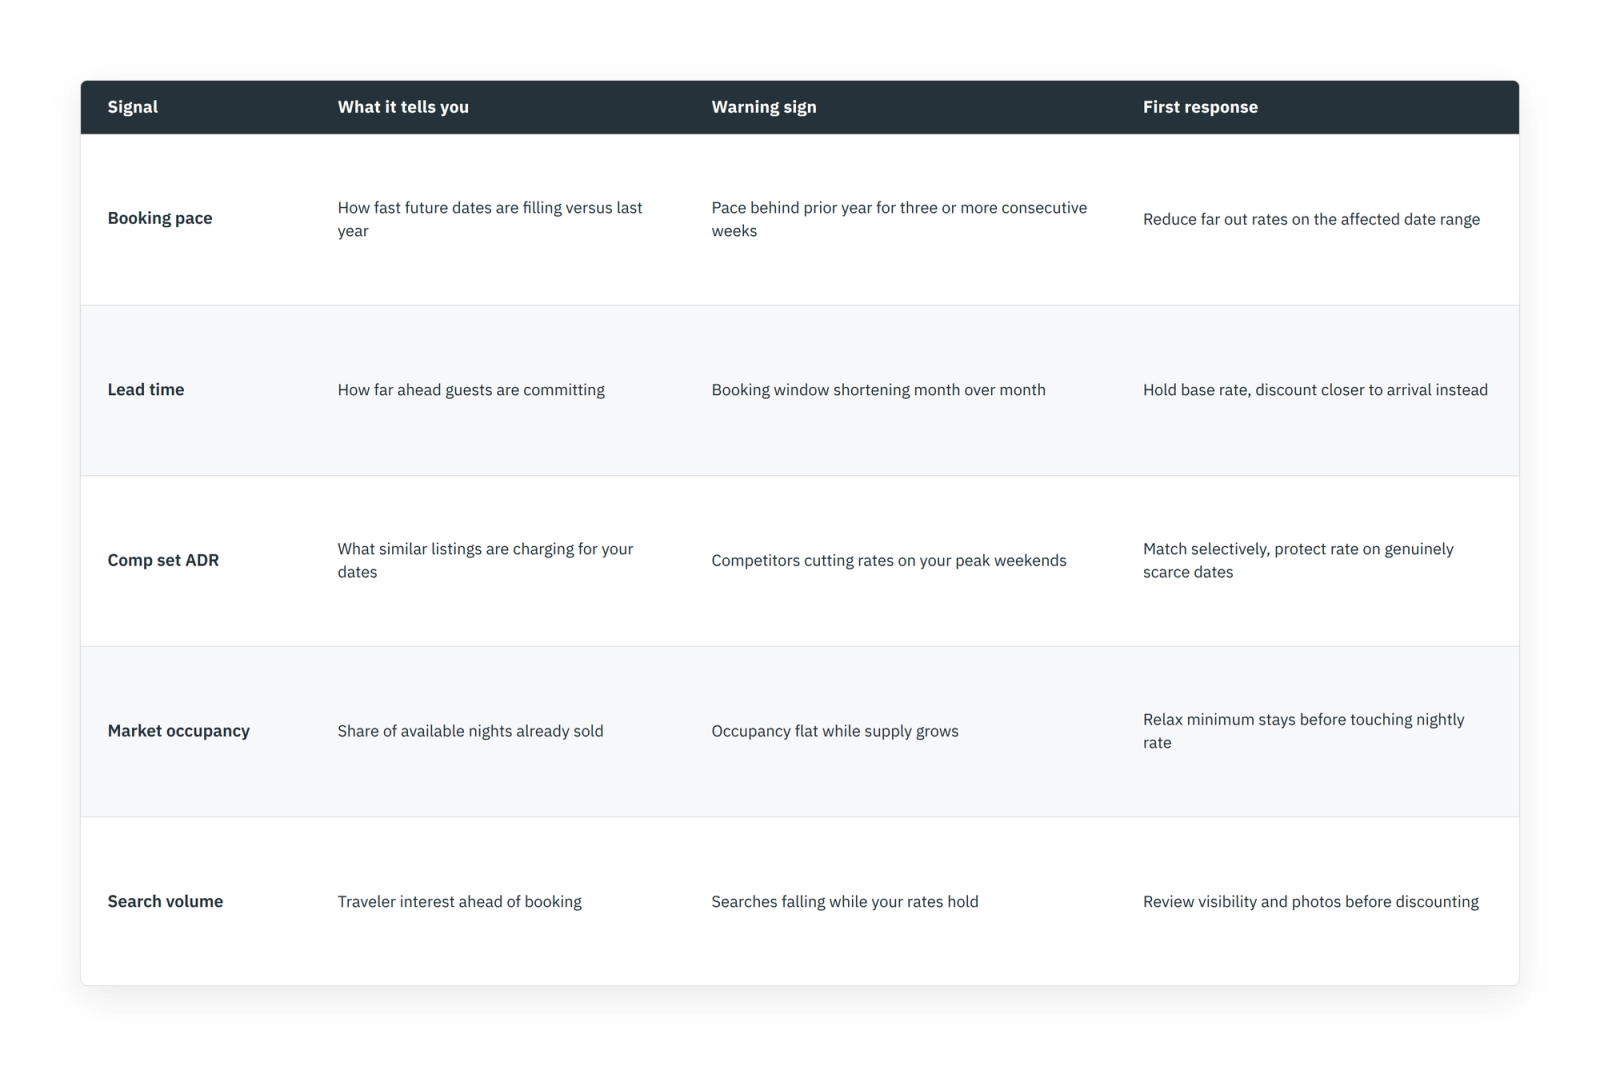
Two rules make this table useful. Check the same signals on the same day each week, and always compare against the same period last year rather than last month. Consistent dashboard settings keep those comparisons honest.
Colorado ski country ran into near historically dry conditions in early 2026. Across the seven state western mountain region, Inntopia reported January average daily rate down 4.2% for arrivals through April, contributing to roughly $17.8 million less revenue for the month. Colorado's own losses ran deeper than the regional average, and urban and resort markets diverged sharply.
AirDNA's January 2026 analysis put ski destination bookings down about 5% nationally, with Colorado resort markets ranging from 5% in Vail to 35% in Telluride. That spread is the point. A manager pricing off a national number would have badly misread Telluride, which is why granular pacing reports beat headline figures.
Managers who caught it early relaxed minimum stays first, then trimmed far out rates while protecting holiday weeks. That sequencing matters, and pricing offsets let you apply it to specific date ranges rather than the whole calendar.
Event demand signals run the opposite way and rewards the managers watching search activity months ahead. PriceLabs data from the Eras Tour showed Glendale occupancy reaching 80% during concert dates, a 2% lift on the previous week. Across host cities, booked nights grew an average 30% year over year and median prices rose between 15% and 23%, as the Eras Tour data sets out in detail.
Other event analyses show the same pattern at different scales. The Paris Olympics impact, the Super Bowl demand study, and the eclipse demand spike all traced surges that began well before the event date.
The practical move is to shorten minimum stays for event weekends rather than extend them. Event travelers book short trips, and long stay requirements push them elsewhere, as the trend masterclass covers.
March 2026 US inflation reached 3.3%, driven largely by gasoline prices following oil shipping disruption. AirDNA linked weak snowfall to a 5.3% year over year demand drop in mountain destinations that same month, while coastal markets like San Diego and San Francisco posted occupancy growth. Broad economic shocks rarely hit every market the same way.
Fuel costs matter most for drive to markets, where a full tank is a visible share of trip budget. AirDNA's 2026 midyear outlook also found lead times compressing and trips shortening across US markets. Both changes argue for dynamic pricing that holds base rates longer and discounts later, which pricing automation handles without daily manual work.
Acting on vacation rental demand trends works best as a routine. Start with a weekly review slot you actually keep. Fifteen minutes on the same morning each week beats an hour of frantic checking after a bad month, and revenue management tips consistently rank cadence above sophistication.
Segment before you act. Filter by bedroom count, neighborhood, and amenity, because a hot tub in Gatlinburg and a ski in unit in Breckenridge respond to entirely different signals. Market Dashboards lets you build those filtered views once and reuse them weekly.
Change one variable at a time, and let dynamic pricing carry the change across the portfolio. If pace is soft, try relaxing minimum stays for a week before cutting rates, since restriction changes recover faster than price cuts do. Dynamic Pricing applies those adjustments across the portfolio, and customization rules keep property level exceptions intact.
Then measure the response. Give any change seven to ten days before judging it, and compare pickup against the same window last year rather than against your expectations. Managers running fine tuned strategies treat each adjustment as a test with a result.
Keep local knowledge in the loop. A road closure, a new hotel, or a cancelled festival will not appear in your market data before it appears in your inbox, and one manager's workflow example shows how that blend works in practice.
Owners forgive a rate cut they understood in advance, especially when vacation rental demand trends explain it. They do not forgive one they discovered in a statement, which is why owner trust is built before the difficult month rather than during it.
Lead with the market, not the property. Show what comp set occupancy and ADR did, then show where the property landed against that benchmark. Portfolio Analytics produces that comparison across every listing you manage.
Send it on a schedule rather than on demand. A short monthly note with three charts prevents most anxious phone calls, and the report builder makes assembling it a repeatable task.
Slow seasons need a different script than shock events. Guidance on slow season conversations and on slow season occupancy covers both angles.
Vacation rental demand trends will keep moving in ways nobody forecast, and the managers who do well are the ones who notice sooner and respond smaller. Weekly demand signals, segmented market data, single variable changes, and honest owner reporting cover most of what matters. Set the routine now, before the next surprise arrives. Start with the annual checks that put your baseline in order, then let market analytics handle the daily watching.
Compare recent pickup against the same period last year for at least three consecutive weeks. Single week movements are usually noise tied to weather or a local event, as pacing reports make clear. A consistent gap across multiple weeks and multiple date ranges signals a real shift that warrants a pricing change.
Weather, events, economic conditions, and supply growth are the four main drivers, and market comparisons show how unevenly they land. Weather dominates in seasonal markets like ski and beach destinations. Fuel prices and inflation hit drive to markets hardest, while events create short sharp spikes that reward early detection.
Relax minimum stays first, since restriction changes are easier to reverse than rate offsets. If pace stays behind after a week, reduce far out rates while protecting genuinely scarce dates. Avoid cutting across the whole calendar, because that trains guests to wait for discounts.
Weekly is enough for most portfolios under 50 properties, and saved dashboard settings keep it quick. Set a fixed slot and review the same signals each time. Daily checking during a known disruption such as a snow drought or a major event is worth the extra time.
Show comp set occupancy, comp set ADR, and booking pace against the same period last year using report builder exports. Then show where their property sits relative to that benchmark. Finish with the specific changes you made and the pickup since, so the conversation stays about evidence rather than opinion.
Demand trends should inform the same pricing decisions covered in our complete guide to dynamic pricing for short-term rentals.
Want to learn what PriceLabs can do for you? See for yourself with a free trial. Get started now!