
Get started with PriceLabs now!
Want to learn what PriceLabs can do for you? See for yourself with a free trial. Get started now!
Portfolio analytics is essential for hosts, property managers, and revenue managers running vacation rentals on Airbnb, Vrbo, and direct booking channels. It provides clear insights into booking trends, revenue drivers, and market comparisons, enabling better pricing decisions. Portfolio analytics is one piece of the broader revenue management strategy property managers need, and with real-time data and comprehensive performance metrics, it helps you optimize pricing while identifying areas to increase occupancy and total revenue.
Portfolio Analytics refers to tools that aggregate performance data across your entire short-term rental portfolio. It offers detailed reporting on revenue, booking patterns, length of stay, lead times, occupancy rates, and pricing metrics. This high-level and granular visibility empowers you to make data-driven Airbnb pricing decisions that respond to demand shifts and competitor behavior.
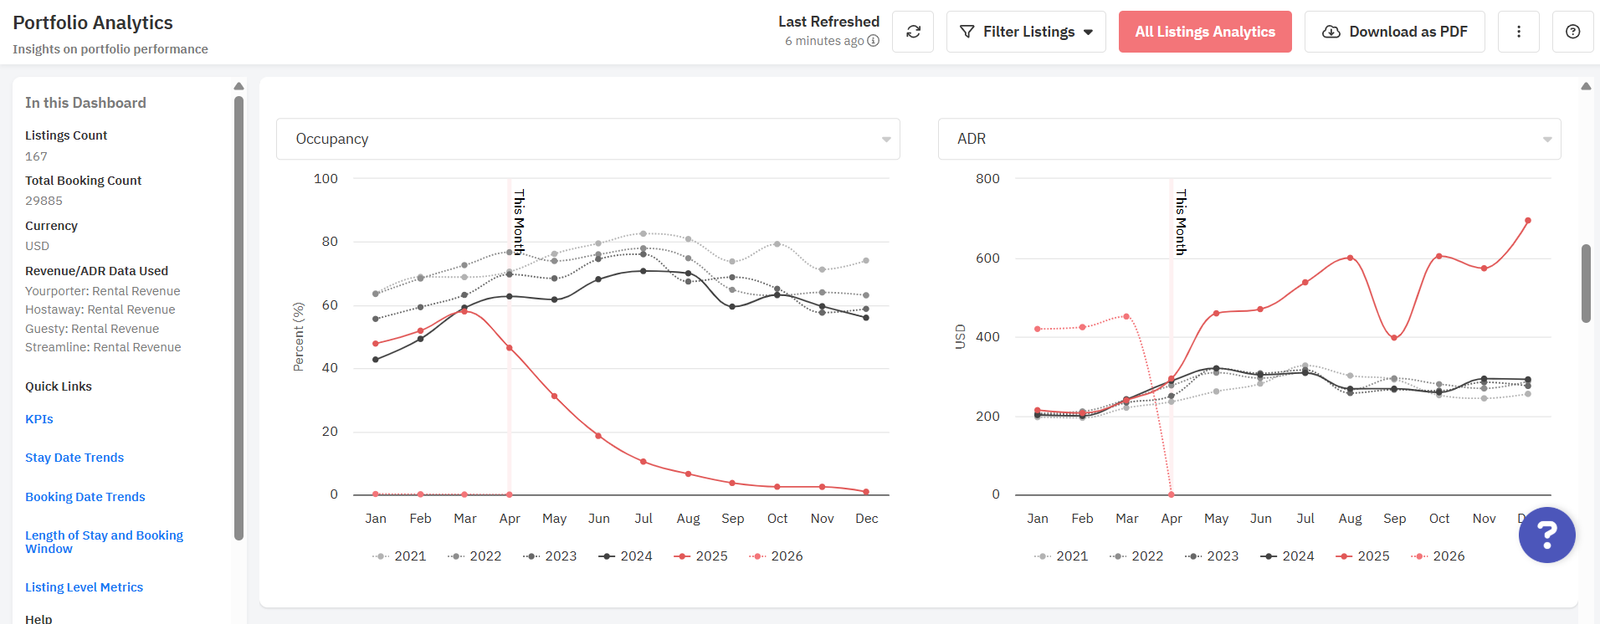
For vacation rental managers juggling multiple listings, portfolio analytics simplifies complex data into actionable insights filtered by property, group, date, or market segment, which matters even more once you're managing properties for other owners and need to justify your fee with results.
Compared to tracking each listing individually, portfolio analytics paints the bigger picture, highlighting portfolio-wide trends, strengths, and weak spots. This helps improve pricing strategy to reduce vacancy and increase revenue while ensuring that minimum stay rules and last-minute pricing adjustments align with booking patterns.
When developing a pricing strategy using portfolio analytics, focus on several key performance indicators and trends, the same core vacation rental KPIs worth tracking on any single listing, just rolled up across your whole portfolio:
Using filters for PMS, listing tags, groups, and date ranges allows segmented analysis, helping to uncover hidden opportunities like underpriced high-demand listings or overlooked slow seasons.
To improve your Airbnb pricing strategy:
Real-time synchronization with Airbnb, Vrbo, and other channels ensures that your portfolio analytics reflects your latest bookings and listed prices, helping keep your strategy agile and competitive.
Market comparisons are critical to avoid both underpricing and overpricing. PriceLabs' Market Dashboards provide neighborhood-level data and benchmarking tools using a customizable radius and filters such as bedroom count and comp sets, informed by the same local market analysis that should be driving your comp set selection in the first place.
With Portfolio Analytics integrated with Market Dashboards:
This combined insight drives a pricing strategy that is responsive not only to your listings' historical performance but also to real-time market conditions.
Portfolio Analytics works closely with Market Dashboards and Dynamic Pricing (powered by the Hyper Local Pulse algorithm) to provide a unified view of your performance and market context. Real-Time Sync keeps your listings' rates and minimum stay rules current across Airbnb and Vrbo, while min/max price limits protect your pricing boundaries to meet your revenue goals safely.
Portfolio Analytics offers detailed charts and tables for listing-level analysis. Here's how to use them:
For revenue managers, exporting these insights into regular reporting aids in communicating performance to owners and stakeholders with clarity.
Step
Action
Goal
1
Review portfolio KPIs monthly.
Spot trends and measure growth or decline.
2
Compare listing-level occupancy and ADR.
Identify strong and underperforming properties.
3
Analyze booking windows and LOS trends.
Set appropriate minimum stay and last-minute pricing.
4
Match portfolio performance against Market Dashboards.
Adjust base prices and seasonal profiles accordingly.
5
Set min/max price limits for base pricing.
Protect revenue goals while allowing dynamic pricing freedom.
6
Schedule regular review and adjustments.
Keep pricing responsive to market and booking behavior changes.
Portfolio Analytics focuses on your listings' historical and current performance data across key metrics. Market Dashboards provide external market data from comparable listings in your area's neighborhood. Combined, they give a complete picture of your portfolio against the competitive landscape.
By revealing booking trends, stay lengths, and revenue by listing, Portfolio Analytics helps you identify when to raise or lower prices. It supports data-driven minimum stay rules and last-minute pricing decisions that maximize occupancy and revenue.
Yes, if you are connected directly with Airbnb through PriceLabs, you can request Portfolio Analytics activation. It also supports PMS integrations offering comprehensive data for your portfolio.
Portfolio Analytics updates in real time or daily depending on the channel and sync frequency. Combined with Real-Time Sync, you can trust your data reflects recent bookings and price changes.
Absolutely. The tool offers exportable tables and custom reports to communicate performance metrics to property owners, aiding transparency and improving owner relations.
Effective Airbnb pricing involves combining listing-level and market-level data to react in time to changing demand. Portfolio Analytics is your data compass for navigating this complexity, and pairing it with a regular reporting habit turns that data into consistent action rather than a dashboard you check once and forget. Once your metrics are in order, forward-looking revenue estimation is the natural next step for planning ahead rather than just reviewing the past.
Portfolio analytics is one part of the fundamentals covered in our complete guide to property management.
Want to learn what PriceLabs can do for you? See for yourself with a free trial. Get started now!