Get started with PriceLabs now!
Want to learn what PriceLabs can do for you? See for yourself with a free trial. Get started now!
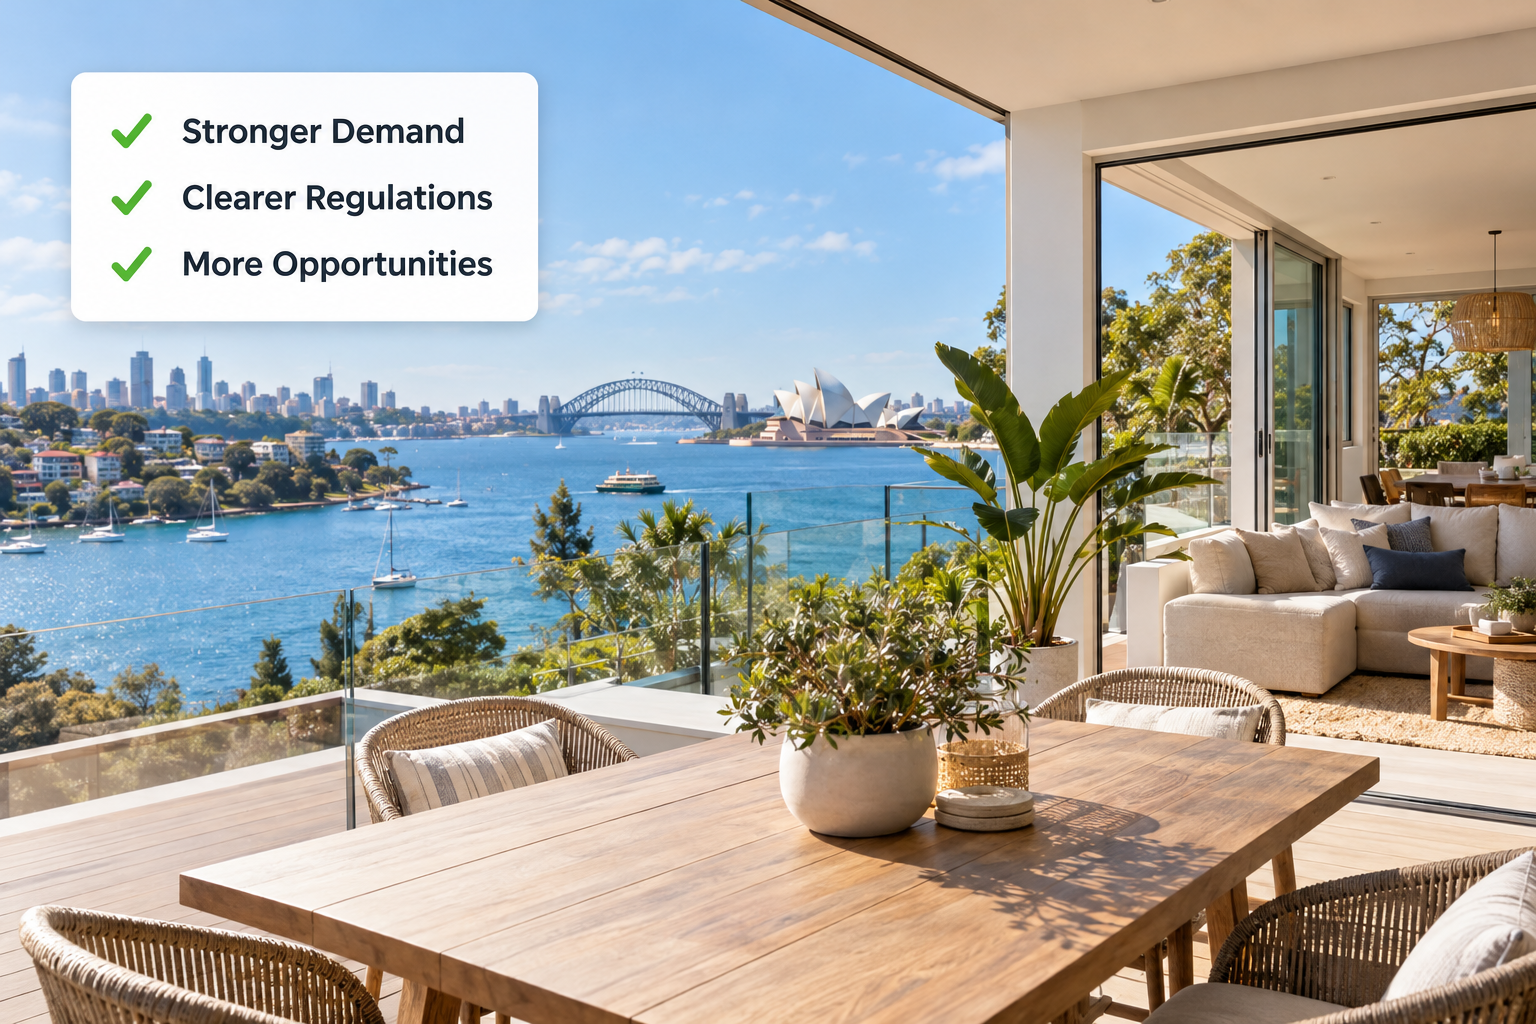
Between November 2025 and October 2026, Australia's short-term rental market averaged 66.6% occupancy, an ADR of AUD 339.98 and a RevPAR of AUD 227.50, according to PriceLabs market data. Active listings reached 171,543 in October 2026.
| Metric (Nov 2025 to Oct 2026) | Australia |
|---|---|
| Average occupancy | 66.6% (+1.0 pp year over year) |
| Average daily rate (ADR) | AUD 339.98 (-2.0% year over year) |
| RevPAR | AUD 227.50 (-0.6% year over year) |
| Active listings, October 2026 | 171,543 |
Supply grew about 4% over the period, from 164,952 listings in November 2025 to 171,543 in October 2026.
The year split in two. From November to February, occupancy ran 5.0 to 6.7 points above the prior year while ADR ran 4.4% to 6.5% below it. From June to October, ADR ran 0.3% to 2.3% above the prior year while occupancy ran 0.7 to 1.6 points below it. In 2024-25, by contrast, occupancy climbed in every peak month as listings grew 5.6%.
Summer is the peak and late autumn is the low point.
| Month | Occupancy | ADR (AUD) | Median booking window |
|---|---|---|---|
| December 2025 | 72.0% | 421.08 | 38 days |
| January 2026 | 74.2% | 395.34 | 28 days |
| May 2026 | 59.5% | 295.16 | 14 days |
| June 2026 | 60.1% | 319.33 | 15 days |
Occupancy recovered to 65.7% in July and reached 68.6% by October. The median stay was 4 nights in most months and 5 nights in January.
The three largest states held about 80% of national listings in October 2026.
| October 2026 | Active listings | Occupancy | ADR (AUD) | RevPAR (AUD) |
|---|---|---|---|---|
| New South Wales | 59,359 | 67.2% | 402.50 | 270.46 |
| Victoria | 43,542 | 61.7% | 306.06 | 188.74 |
| Queensland | 35,030 | 75.0% | 359.21 | 269.57 |
Seasonality differs by state:
December was the ADR peak in all three states: AUD 506.10 in New South Wales, AUD 428.62 in Queensland and AUD 378.47 in Victoria.
Brisbane will host the Olympic Games from 23 July to 8 August 2032, with most competition venues in Brisbane, the Gold Coast and the Sunshine Coast, according to the Queensland Government's master plan. July is already Queensland's strongest month in the current data, at 79.4% occupancy. How much extra demand the Games add is still unknown, so the practical step is to track pacing and rates for those dates as they approach.
Supply is up about 4% and, since June, rates are only slightly above last year. Dynamic pricing adjusts nightly rates to demand, seasonality, events and competitor pricing, so each listing keeps pace with its own market.
Booking windows shorten sharply in May and June, which makes last-minute discounts and orphan-night discounts the main tools in those months. In December and January, longer windows reward setting rates and minimum stays early. Tracking pacing and RevPAR alongside occupancy through short-term rental analytics shows whether your market is running ahead of or behind last year.
Occupancy averaged 66.6% between November 2025 and October 2026, up 1.0 percentage point year over year. January was the peak month at 74.2% and May the low at 59.5%.
ADR averaged AUD 339.98 over the same period, down 2.0% year over year. December had the highest ADR at AUD 421.08.
PriceLabs market data shows 171,543 active listings in October 2026, up about 4% from 164,952 in November 2025.
Queensland, at 75.0% in October 2026, compared with 67.2% in New South Wales and 61.7% in Victoria.
The Olympic Games run from 23 July to 8 August 2032.
Data: PriceLabs market data for Australia, November 2025 to October 2026, in AUD. Olympic dates: Australian Olympic Committee. Venues: Queensland Government, Brisbane 2032 Master Plan.
Want to learn what PriceLabs can do for you? See for yourself with a free trial. Get started now!