
take confident decisions with Market Dashboards
Get a deep, decision-ready view of your market — real booking behavior, segment-level trends, and true competitive benchmarks.
Beyond assumptions. Beyond surface-level charts. See how your market actually works.
Market Intelligence Trusted by Teams Who Need to Be Right
Used by Revenue Managers and Property Managers to align decisions, benchmark accurately, and explain performance with confidence.
Made for Real Benchmarks
Compare performance using customizable Comp Sets built around true competitors — not city-wide averages or generic market stats
Explain, Not Just Analyze
Market Dashboards are used in owner conversations, internal reviews, and planning discussions — with reports people actually trust
Track Trends as Markets Evolve
Teams rely on Market Dashboards to monitor trends, validate strategy, and stay aligned as supply, demand, and booking behavior evolve

SEE CLEARLY. PLAN BETTER
Know What’s Actually Happening in Your Market
Track supply, demand, pricing, and bookings across Airbnb and Vrbo with daily-updated data. See how your market is shifting—not just what happened last year.
COMPARE RIGHT. BENCHMARK WELL
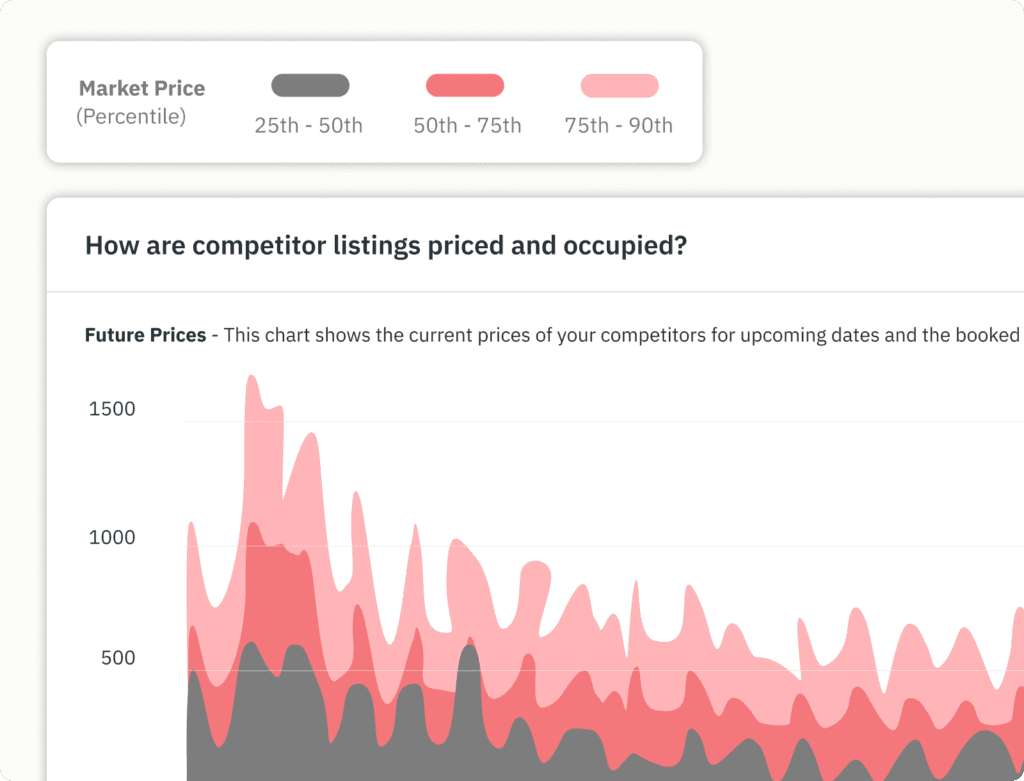
Compare Against the Right Competition
Build custom Comp Sets using 40+ filters—location, bedroom count, amenities, ratings, and more. Benchmark performance against listings that actually compete with yours.
TRACK DEMAND. SPOT SHIFTS
Spot Demand Changes Before It’s Too Late
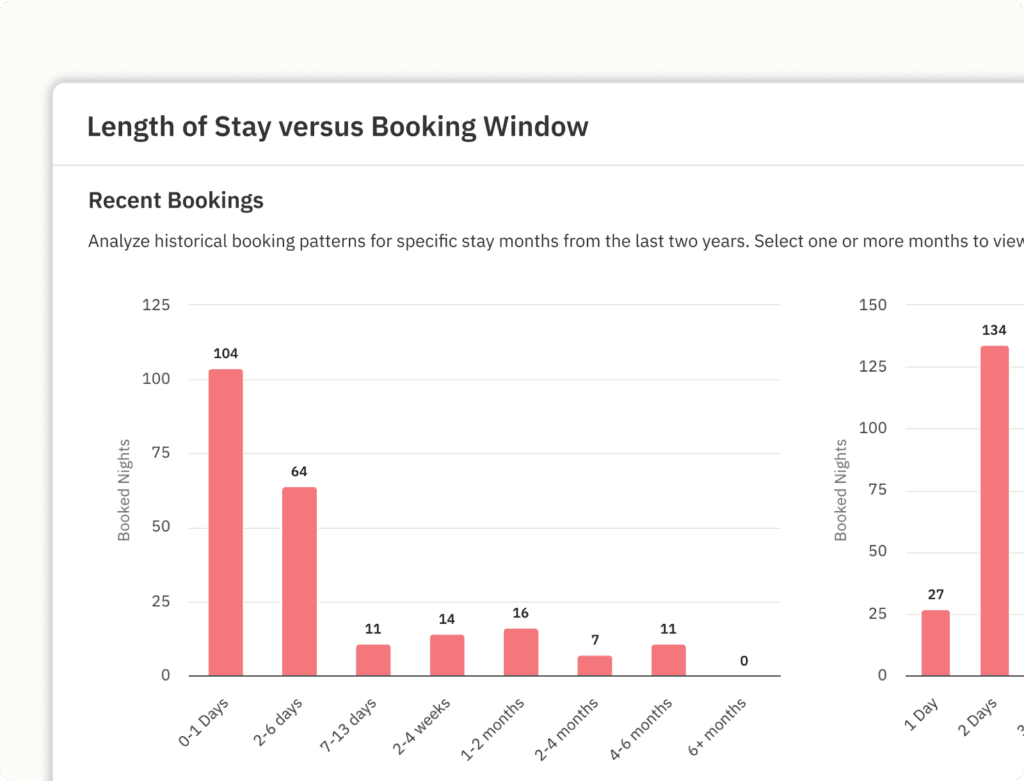
Analyze booking curves, lead time, length of stay, and pacing trends to understand when guests are booking, how long they stay, and where demand is building—or softening.
EXPLAIN CLEARLY. ALIGN EVERYONE
Turn Market Data Into Clear Explanations
Export clean PDF reports, or rely on weekly summary emails to show owners and teams what’s changed—and why your strategy makes sense.

MARKET VIEW TO DECISION IN MINUTES
How Market Dashboards Works
Get 10% credit on each referral's first 12 months. Monitor your performance in real time under "Billing → Refer & Earn".
Step 1: Choose Your Market
Search for a ready-to-view market or draw a custom area on the map
Step 2: Pick Your Focus
Start with guided views for exploration, benchmarking, or demand tracking—or open the full market view
Step 3: Build Comp Sets
Create up to 30 custom Comp Sets to analyze different listings, neighborhoods, or segments
Step 4: Monitor & Share
Track trends over time, export reports, or get automatic email updates
BUILT FOR DEPTH
Everything You Need to Understand Your Market
Powerful insights—without unnecessary complexity
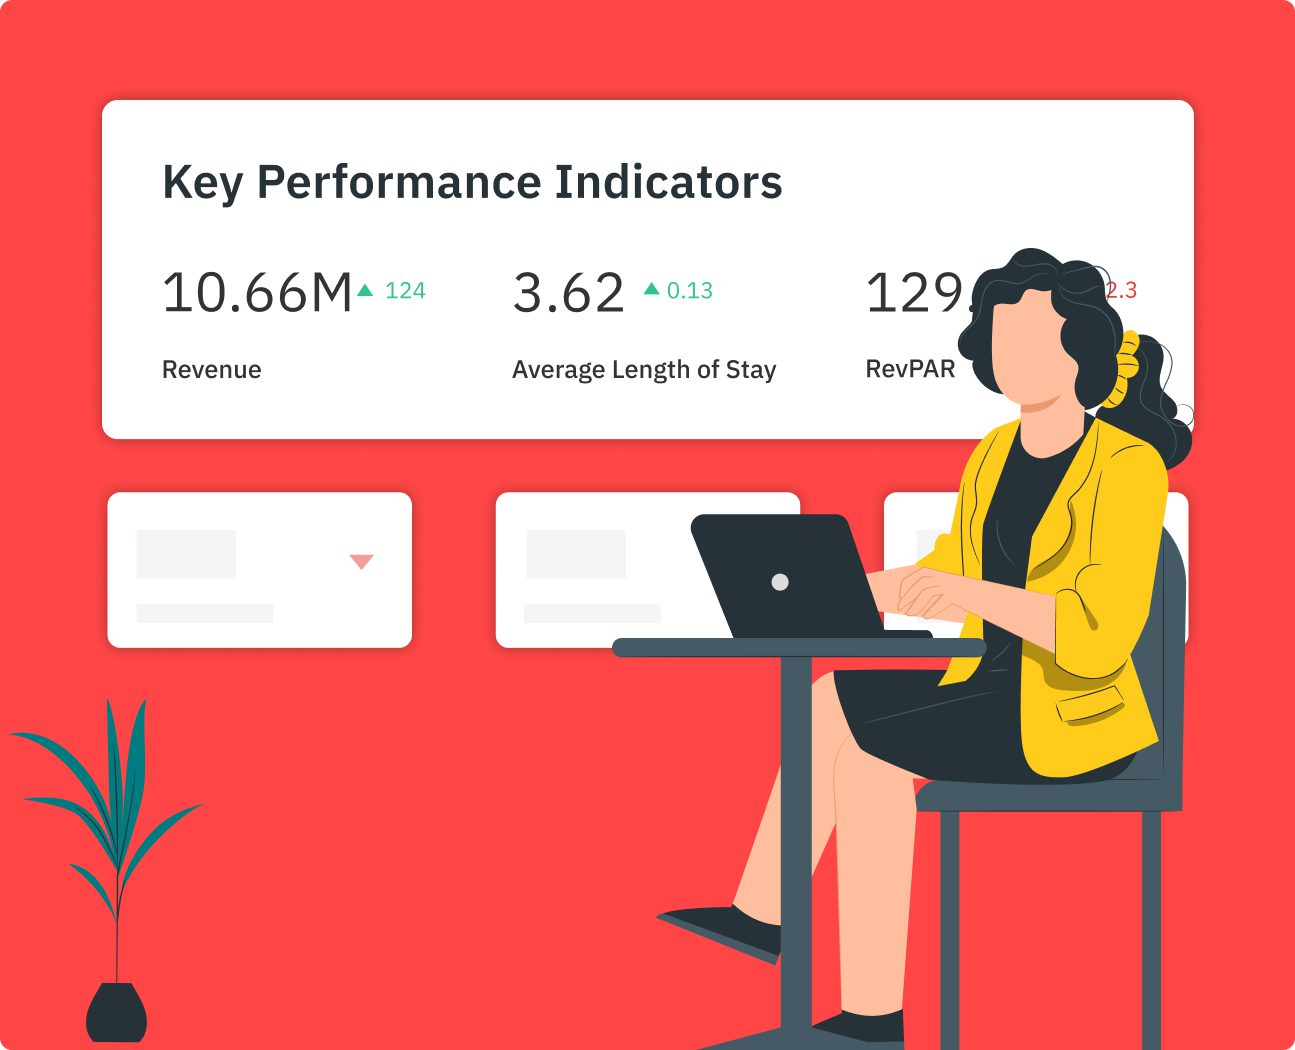
Market KPIs & AI Insights
Revenue, ADR, occupancy, RevPAR, booking window, LOS—with plain-language summaries
Ready-to-View Dashboards
Instant access to popular markets with no setup delay
Custom Market Areas
Draw precise regions to analyze hyper-local performance
Booking Curves & Pacing
See how bookings build over time compared to the market
Amenities & Policies Analysis
Identify what guests value—and where listings over- or under-deliver
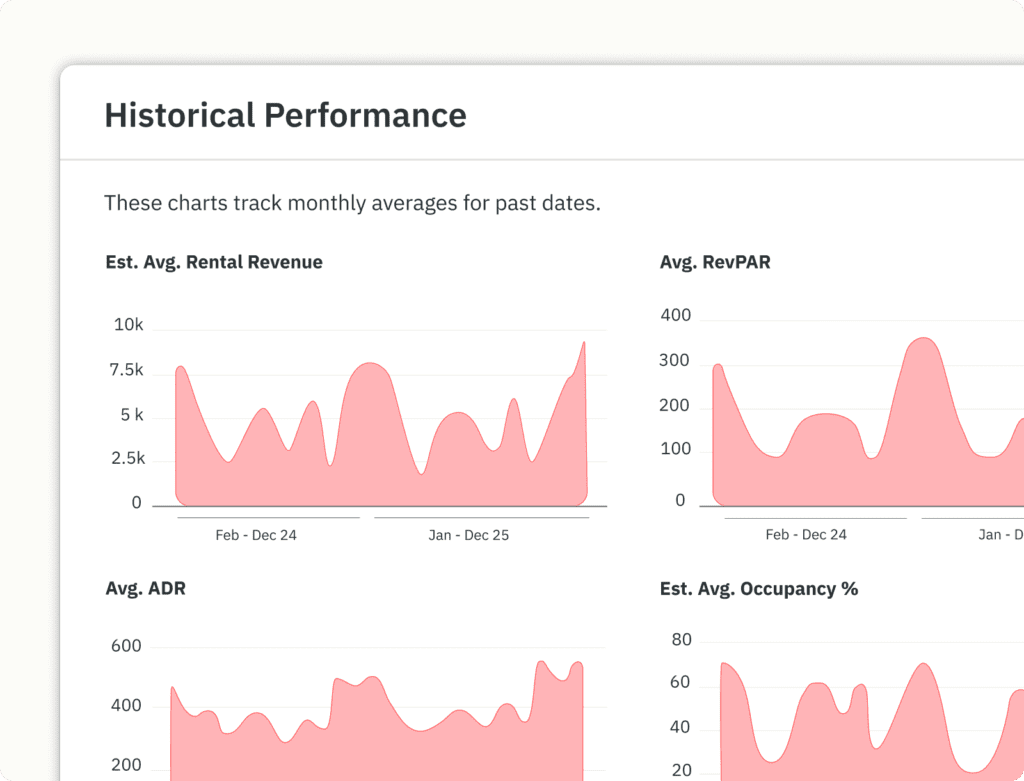
Price & Occupancy Trends
Understand seasonality, day-of-week behavior, and future demand
Advanced Comp Sets
Create and reuse competitor groups across PriceLabs tools
Exports & Email Updates
PDF downloads, and scheduled summaries for teams and owners
Frequently Asked Questions (FAQs)
We collect publicly available short-term and mid-term vacation rental data from Airbnb and Vrbo, which is updated daily. While it doesn’t include direct booking data, it captures direct bookings by tracking OTA availability.
Yes, PriceLabs Market Dashboards provide comprehensive Airbnb market data, with reports functioning like an Airbnb market analyzer.
Yes. Simply search for your location. If there is a ‘Ready-to-View’ Market Dashboard available it will show up in your search. You can instantly review key metrics before subscribing to the dashboard.
Ready-to-View Market Dashboards are pre-built, daily-refreshing dashboards designed for vacation rental investors and property managers to study patterns and analyze popular vacation rental markets worldwide.
- They offer a quick preview of the number of listings, average revenue, RevPar and occupancy percentage before you subscribe
- Are pre-built and load instantly to give you access to comprehensive market insights, pricing trends, occupancy data and more
Yes, you can create a Custom Market Dashboard by specifying an address. You can further refine this by choosing the number of listing you would like to consider in your dashboard, or use the drawing tools available to draw a custom area.
If there’s no Ready-to-View Dashboard in your area yet or when you need hyper-specific insights for a particular address or unique property location, you can choose to create a Custom Market Dashboard.
Once you specify you addess, you can further tailor your dashboard based on the number of listings you want to consider or by drawing a custom area using the drawing tools available.
A Ready-to-View Market Dashboard will allow you to preview the number of listing in that market.
For a Custom Market Dashboard, you can choose how many listing you would like your dashboard to consider— 1k, 5k, or 10k listings.
No, you can create up to 30 Comp Sets within the same dashboard to focus on individual neighborhoods/listing types if the listings are all in the same radius.
Yes, the Market Dashboard includes 8 KPIs, including Annual Revenue. Consider using PriceLabs’ Revenue Estimator Pro tool for detailed investment and revenue estimation.
Comp Sets, or Competitive Sets, are groups of properties similar to yours in location, size, and amenities, which you can customize by filters and property features. Creating Comp Sets in your dashboard allows you to benchmark your property’s performance against competitors and optimize your pricing and marketing strategies. These sets can be saved and accessed in your Dynamic Pricing dashboard under the Neighborhood Data section, ensuring ongoing optimization based on current market conditions.
Yes, charts can be exported as a PDF from the bottom of the page. Data from individual sections can be exported as a CSV using the pink square in the upper right corner of each module. Note: underlying booking data cannot be exported.
Yes, PriceLabs Market Dashboards provide detailed occupancy metrics of Airbnb (and Vrbo) listings in your specified radius, including average revenue, RevPAR, ADR, occupancy percentage, booking window, length of stay and more.
You can customize the data with specific filters and create ‘Comp Sets’ to compare your property with similar listings.
Vacation rental data is crucial for property managers, revenue professionals and investors, offering insights into market trends, booking patterns, occupancy rates, and pricing strategies for informed decisions. This data-driven approach ensures better decision-making, improved pricing strategies, and enhanced investment and revenue performance. PriceLabs’ Market Dashboards gives users access to real-time data, helping them master their market and stay competitive.
Yes, charts can be exported as a PDF from the bottom of the page. Data from individual sections can be exported as a CSV using the pink square in the upper right corner of each module. Note: underlying booking data cannot be exported. PriceLabs Dynamic Pricing is a market pricing tool that focuses on optimizing nightly rates in real time based on demand, seasonality, and local events. While the Market Dashboard aids in strategic decision-making with a broader market view, Dynamic Pricing ensures daily rate adjustments for maximum revenue. Together, they offer a complete solution for managing and maximizing vacation rental revenue and performance.
PriceLabs Market Dashboards offer detailed VRBO and Airbnb listing-level market data reports for 1k, 5k, or 10k listings within a 0.1-50 km radius. They incorporate historical data from the past two years and projections up to one year. Market Dashboards allow the creation of multiple Comp Sets accessible in Dynamic Pricing and Portfolio Analytics tools, with pricing starting at $9.99 for a 1k listing report. In contrast, PriceLabs Revenue Estimator Pro provides instant revenue estimation based on the number of similar listings considered, with charts depicting revenue for the year, Average Daily Rate (ADR), and occupancy for up to 350 listings within a 15 km radius, based on historical data from the past year and Airbnb scraped data. Estimates can be fine-tuned with property feature and amenity filters and specific map locations of comparable properties. Estimates start at $2.50.