Table of Contents
Updated : Mar 18, 2026
Is your revenue management strategy still running on “gut feelings” or manual spreadsheets that can’t keep up with the 2026 market? While nearly 90% of hotels have now moved toward AI-driven, real-time systems to set rates, simply having the technology isn’t enough—you need to know if it’s actually delivering. If you aren’t tracking the right hotel dynamic pricing success metrics, you might be winning on occupancy but losing on total profit. Let’s dive into the 10 critical KPIs that will tell you exactly how your pricing strategy is performing and how you can use PriceLabs to stay ahead of the competition.
1. Revenue per Available Room (RevPAR)
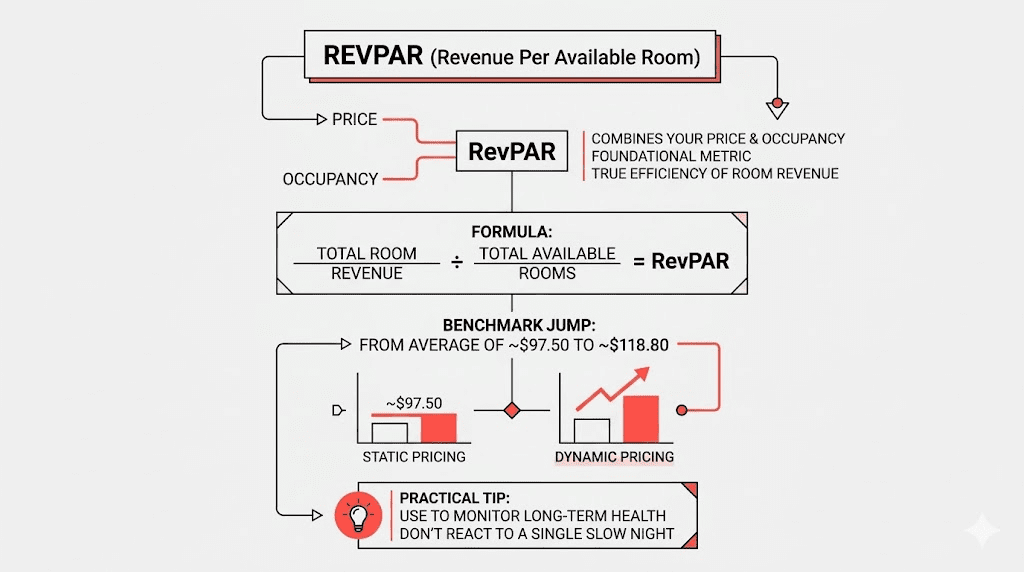
RevPAR is the foundational metric for any hotel revenue optimization metrics dashboard. It combines your price and occupancy into one single number, reflecting the true efficiency of your room revenue.
- The Formula: Total Room Revenue ÷ Total Available Rooms.
- The Benchmark: Transitioning from static to dynamic pricing often sees RevPAR jump from an average of $97.50 to $118.80.
- Practical Tip: Use RevPAR to monitor the long-term financial health of your strategy rather than reacting to a single slow night.
How PriceLabs Helps: PriceLabs helps you maximize RevPAR hotel dynamic pricing by using a “Hyper Local Pulse” algorithm that analyzes local events and real-time market data to ensure you are priced perfectly every day. You can track this effortlessly in the Portfolio Analytics tab, which displays RevPAR through easy-to-read charts.
2. Revenue per Available Guest (RevPAG)
In 2026, a guest is worth more than just their room rate. RevPAG captures the “Full Value” by aggregating room and non-room revenue streams (like F&B or spa services).
- Why it matters: Ancillary spend can elevate total guest value by 15%–40%.
- Strategy: Pair your dynamic pricing with upsell optimization to capture high-value guests.
How PriceLabs Helps
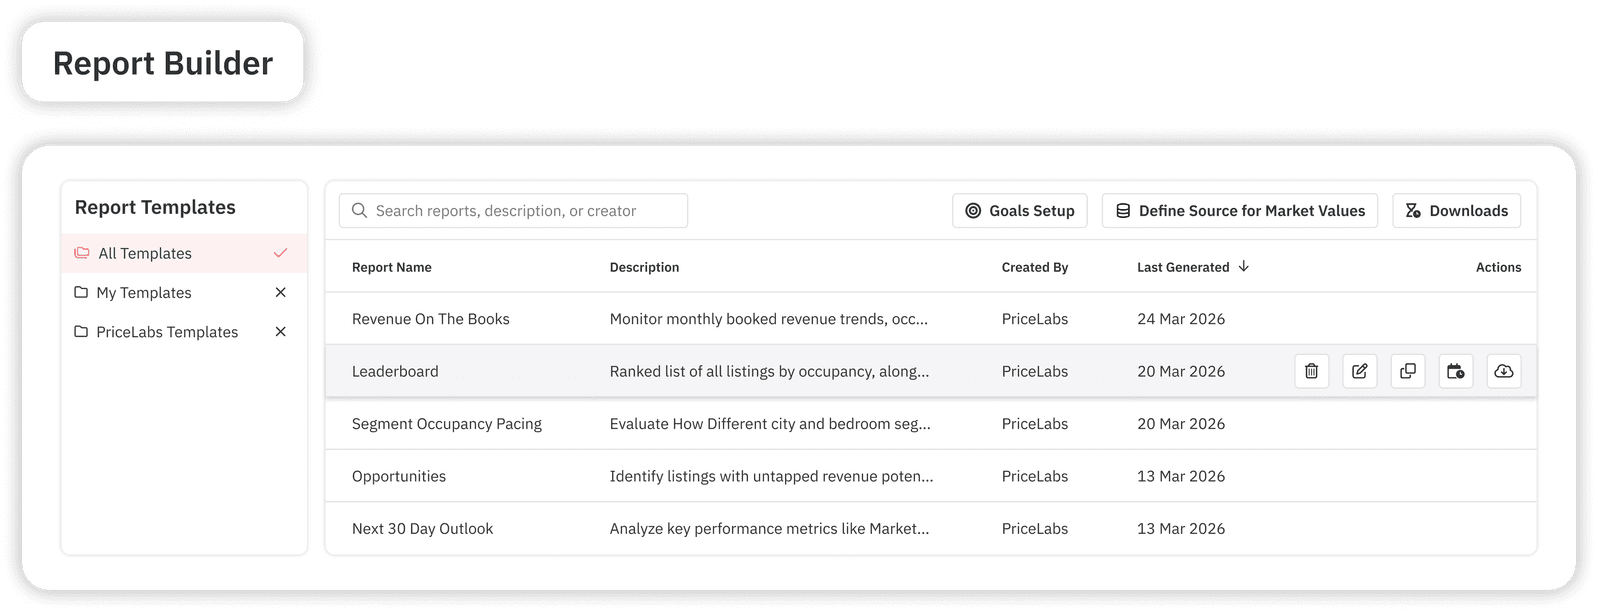
Through the Report Builder, you can create custom reports that include non-room revenue data if integrated with your PMS. This helps you see which pricing segments are driving the most “total” spend, not just the highest room rate.
3. Average Daily Rate (ADR)
ADR reveals the average price paid for occupied rooms and is a vital dynamic pricing performance indicator. It diagnoses your pricing power in a crowded market.
- Benchmark: Dynamic strategies typically deliver a 5%–15% boost in ADR (e.g., moving from a $150 static rate to $165 dynamic).
- Red Flag: High occupancy paired with a low ADR during demand spikes signals that you are underpricing and leaving money on the table.
How PriceLabs Helps
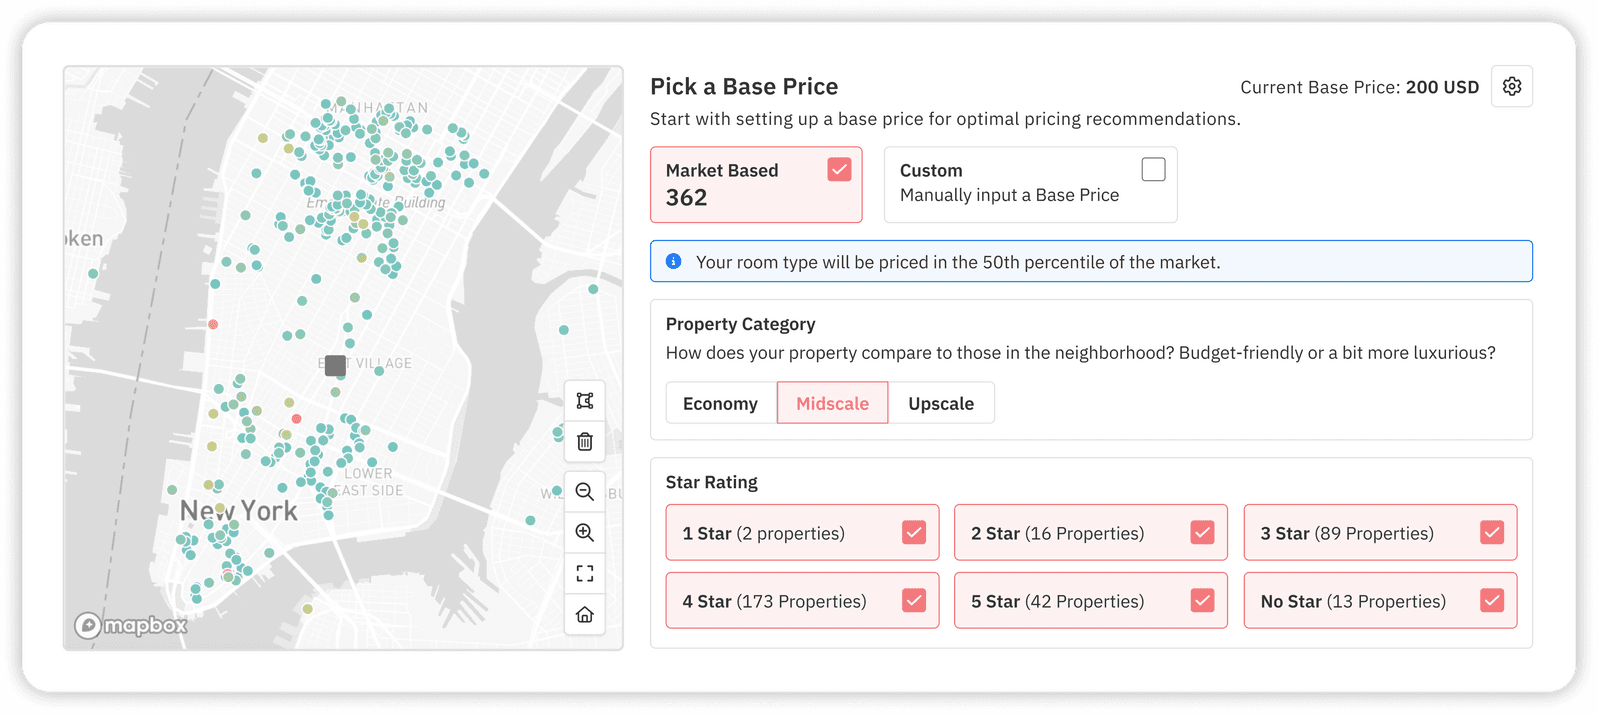
PriceLabs’ Base Price Guidance uses historical performance and current market conditions to help you set a strong starting point for your ADR. It then automatically pushes your rates higher during peak demand without you needing to lift a finger.
4. Occupancy Rate
Occupancy captures how well your inventory is utilized. However, 100% occupancy isn’t always the goal if it means you sold out too cheaply.
- Goal: Prioritize 80%+ occupancy at strong rates over “selling out” at a deep discount.
- The Trend: Dynamic pricing has been shown to improve occupancy from 65% to 72% on average.
How PriceLabs Helps
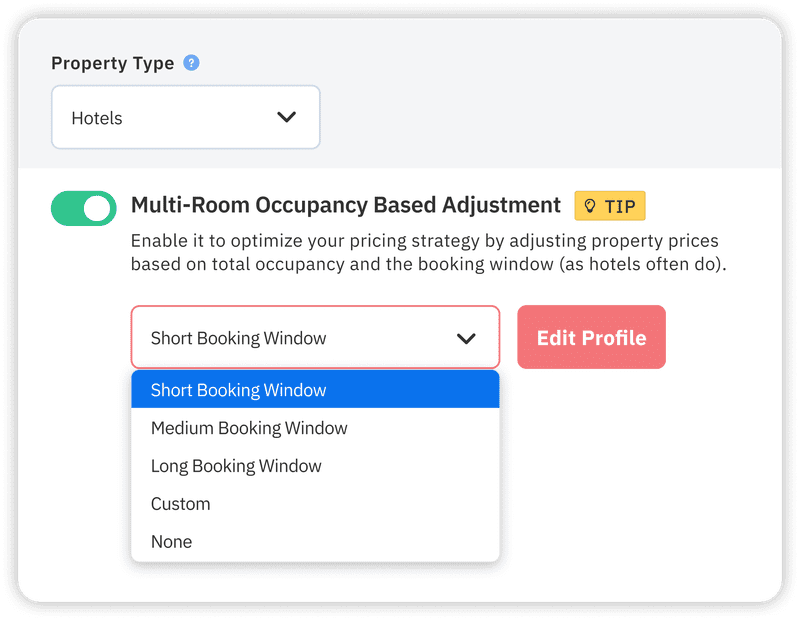
Use Multi-Room Occupancy-Based Adjustments to automatically lower or raise rates based on real-time inventory levels. If your “Standard Double” is filling up too fast,PriceLabs will raise the price to protect your remaining inventory for higher-paying, last-minute guests.
5. Revenue Capture Percentage
This metric shows what share of the “theoretical maximum revenue” your hotel actually realized. It’s the ultimate test of your hotel dynamic pricing success metrics.
- Performance Tiers:
- Low Demand: 50%–65%
- Normal: 65%–80%
- High/Peak: 80%–90%+
How PriceLabs Helps
PriceLabs provides Market Dashboards that allow you to compare your forward-looking occupancy and prices against the total market. If the market is capturing 90% and you are at 70%, you can immediately adjust your Demand Factor Sensitivity in Smart Presets.
6. Booking Pace
Booking pace is your “leading indicator.” It shows how fast your rooms are being booked compared to last year or your forecast.
- Action Step: If a date is running 20% ahead of pace, it’s a clear signal to increase your rates.
- Practical Tip: Review your pace at least 2-3 times per week to catch sudden surges.
How PriceLabs Helps
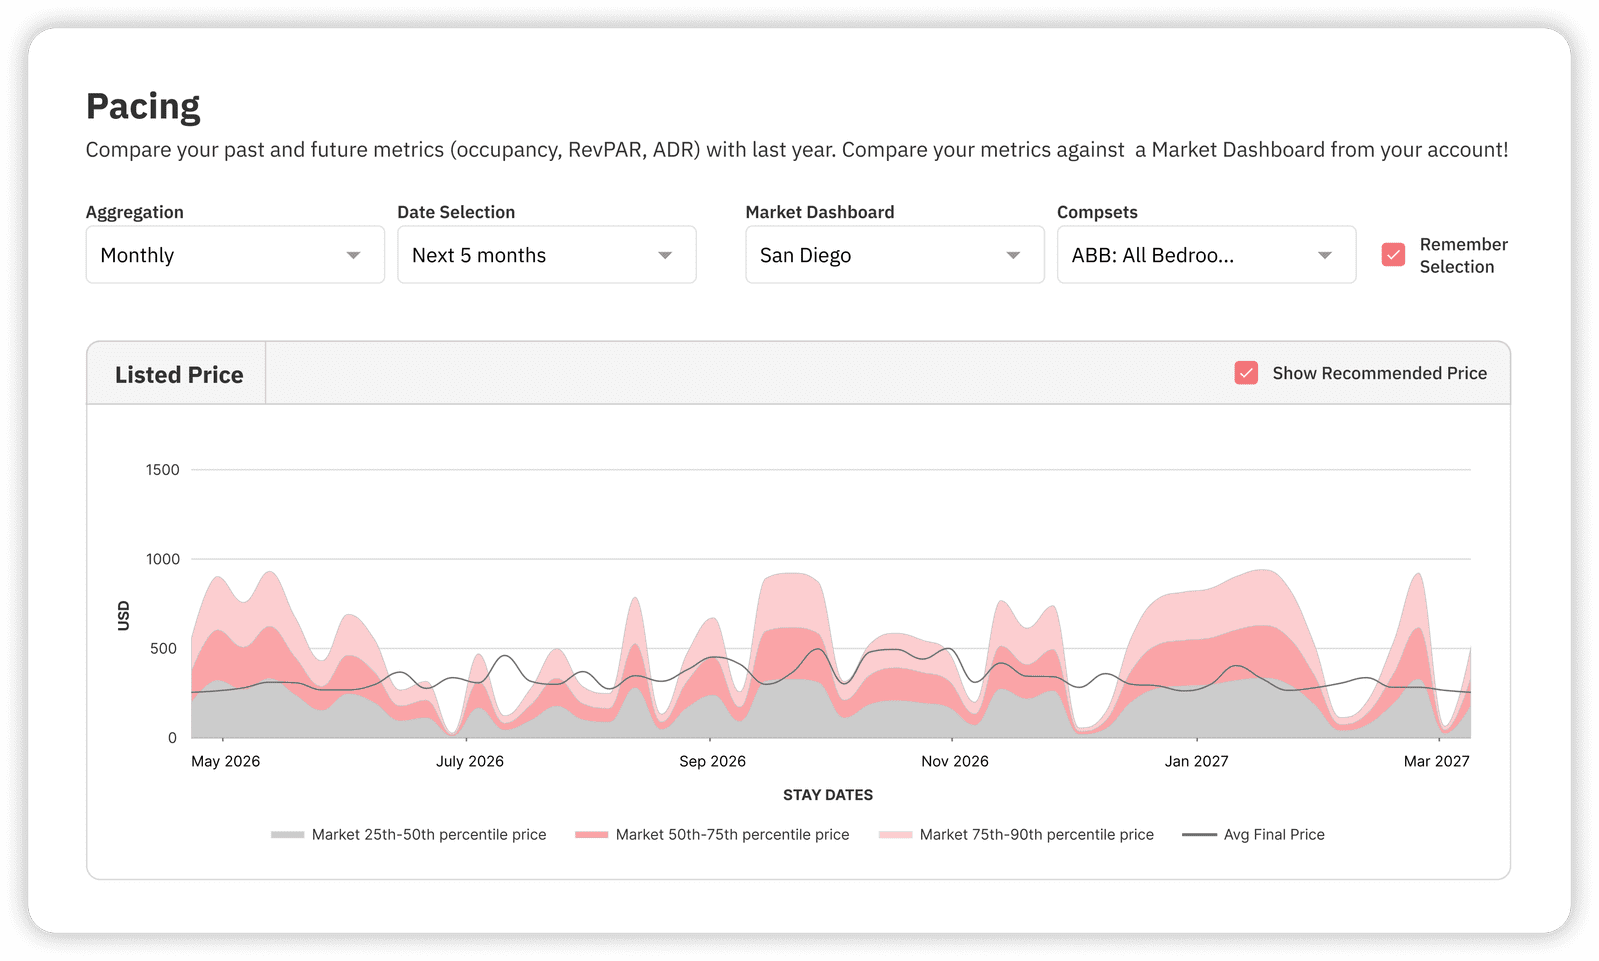
The Pacing Reports in PriceLabs visualize your booking curves, allowing you to see if you are filling up “too fast” compared to the market benchmark.
7. Booking Window and Lead Time Distribution
Understanding when people book allows you to deploy targeted “Advance Purchase” or “Last-Minute” strategies.
- 21+ Days: Common to offer 10%–20% off for early birds.
- 0–7 Days: Adjust for last-minute demand or occupancy gaps.
How PriceLabs Helps
Navigate to Smart Presets and adjust your Booking Recency Factor. This automatically applies temporary discounts to room types that haven’t seen action recently, helping you regain visibility on OTAs without manual tracking.
8. Conversion Rate Across Channels
Conversion measures how many “lookers” became “bookers” on different platforms (Direct vs. OTA).
- Fact: Strategic hotel campaigns can lift direct booking conversion by over 50%.
- Strategy: Use different rates for different channels (Rate Parity) to drive more direct, commission-free business.
How PriceLabs Helps: PriceLabs supports Rate Plan Syncing, allowing you to push different pricing adjustments to refundable vs. non-refundable plans across 160+ PMS integrations.
9. Competitive Set Index and Market Position
You cannot price in a vacuum. Your Comp-Set Index compares your rates to your closest rivals.
- Pro Tip: Your comp-set should inform your pricing, not dictate it. Don’t follow a competitor into a “race to the bottom”.
How PriceLabs Helps
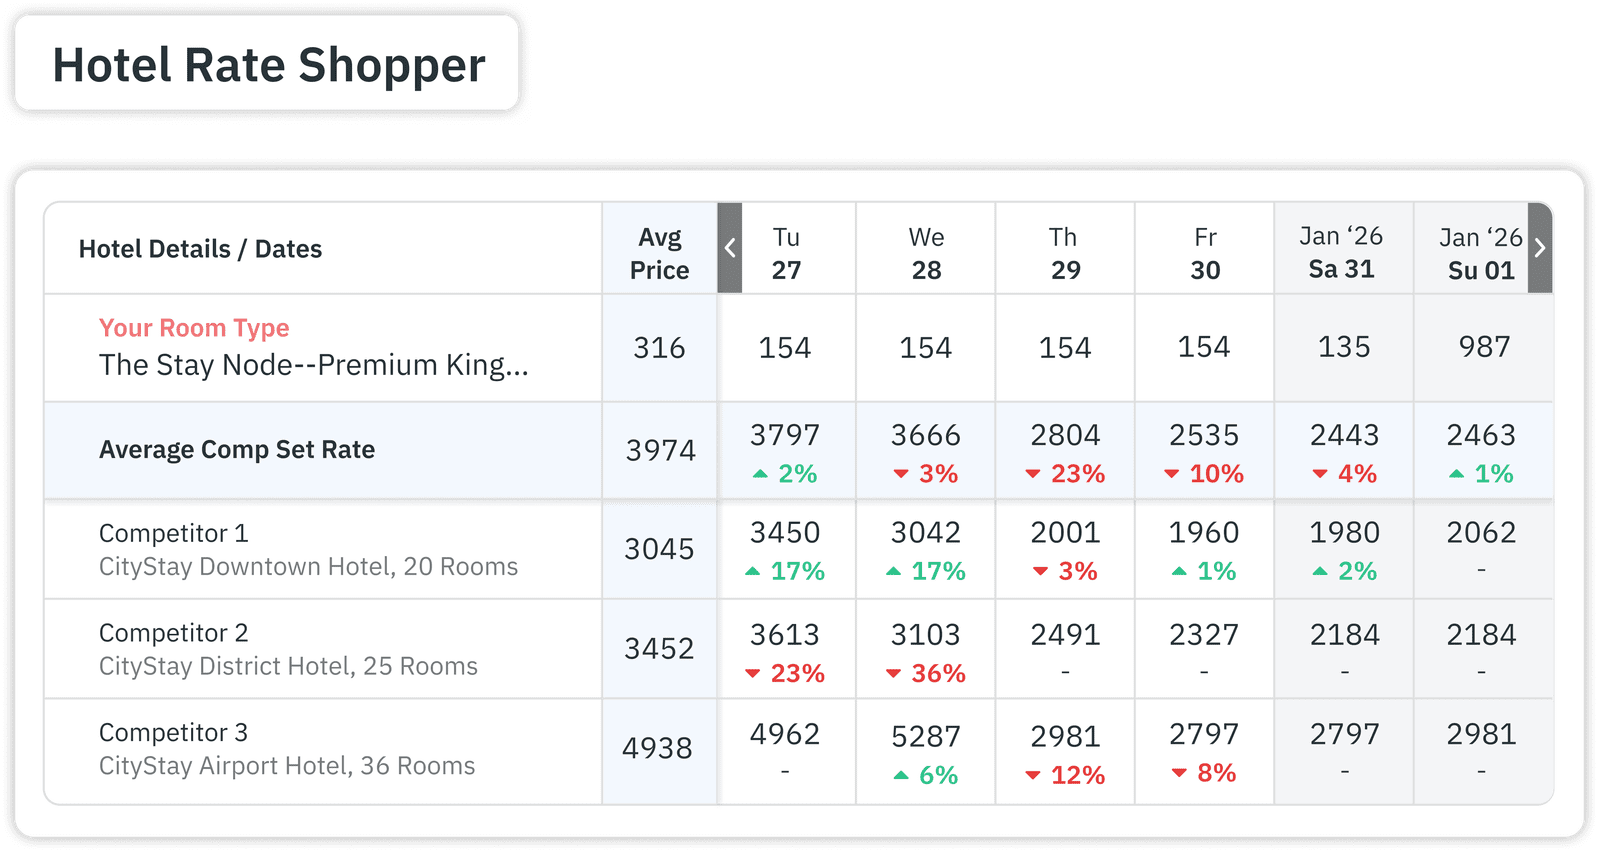
The Hotel Rate Shopper lets you monitor up to 350 nearby properties. You can create Custom Comp Sets so your AI-recommended rates are only influenced by the properties your guests actually consider.
10. Automation and Compliance Metrics
Efficiency is the hidden metric. Are your rates syncing correctly? Are you overriding the system too often?
- ROI Benchmark: Teams typically save 10–15 hours per week by automating pricing tasks.
- Metric: Track your “Manual Override Frequency”—if it’s high, you may need to adjust your Base Price or Sensitivity settings.
How PriceLabs Helps
PriceLabs offers Real-Time Sync (up to 24 times a day) to ensure your rates are always current across all platforms. You can also use Teams & Logs to see exactly who made changes and why, ensuring full operational accountability.
Way Forward
Mastering hotel dynamic pricing success metrics in 2026 is the difference between a hotel that survives and one that thrives. By moving away from manual adjustments and toward a data-driven approach, you can stop “wearing too many hats” and start focusing on guest experience.
Your next step: Log into your PriceLabs dashboard today and check your Pacing Report. If you see your pace is significantly ahead of last year, it might be time to toggle on your Enable Price Sync and let the AI capture that extra revenue for you.
Frequently Asked Questions (FAQs)
What is RevPAR and why is it critical for dynamic pricing?
RevPAR (Revenue Per Available Room) is the primary metric for evaluating how well dynamic pricing maximizes revenue because it accounts for both the rate you charge and how many rooms you actually sell.
How do occupancy rates impact pricing strategy effectiveness?
Occupancy rates act as a signal; effective dynamic pricing aims for high-value occupancy at optimal rates. If occupancy is too high too early, your rates are likely too low.
How can booking pace and booking window metrics improve rate decisions?
They act as “early warning” signals. If the booking window is shortening or pace is accelerating, you can proactively raise rates before you sell out at a lower price.
What role does competitor pricing play in measuring success?
Competitor pricing provides essential market context. PriceLabs allows you to track these trends in real-time so you stay competitive without manually checking websites every day.
How do automation and compliance metrics influence revenue management outcomes?
They ensure your strategy is actually being executed. Automation reduces human error and “sync latency,” ensuring your optimal prices are live on OTAs the moment demand shifts.