Get started with PriceLabs now!
Want to learn what PriceLabs can do for you? See for yourself with a free trial. Get started now!
You raised your ADR last quarter. Your nightly rates looked strong on paper. But when you pulled the revenue numbers at the end of the month, total income was flat — because occupancy had quietly dropped in response. Or maybe the opposite happened: you filled the calendar, hit 85% occupancy, and felt great about it until year-end, when you realized the margins were razor-thin because operational costs had eaten through the gains. If either of those scenarios sounds familiar, you need a vacation rental revenue model strategy that tracks all three legs of the stool — not just one. This guide gives Growing Property Managers the complete revenue management framework to build and monitor performance across 6–49 properties.
A complete vacation rental revenue model strategy tracks three interdependent metrics: ADR (average revenue per booked night), occupancy rate (percentage of available nights booked), and net profit margin (revenue minus all operational costs). RevPAR — calculated as ADR multiplied by occupancy rate — is the single number that reflects the combined health of your pricing and calendar strategy, making it the primary performance benchmark for portfolio-level revenue management.
Before you can build a vacation rental revenue model strategy, you need to understand what each metric actually measures — and why tracking any one of them in isolation gives you a false picture. These are the vacation rental KPIs that drive real performance decisions.
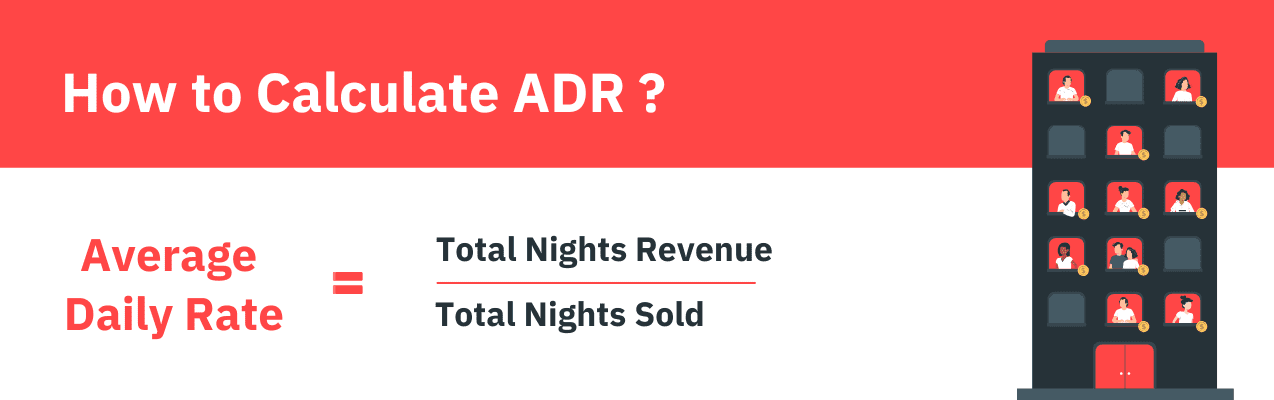
ADR (Average Daily Rate) is your total revenue divided by your booked nights. It measures pricing effectiveness per booking — how much you earn each time someone checks in. A high ADR looks impressive, but if your calendar is half-empty, that rate isn't doing enough work.
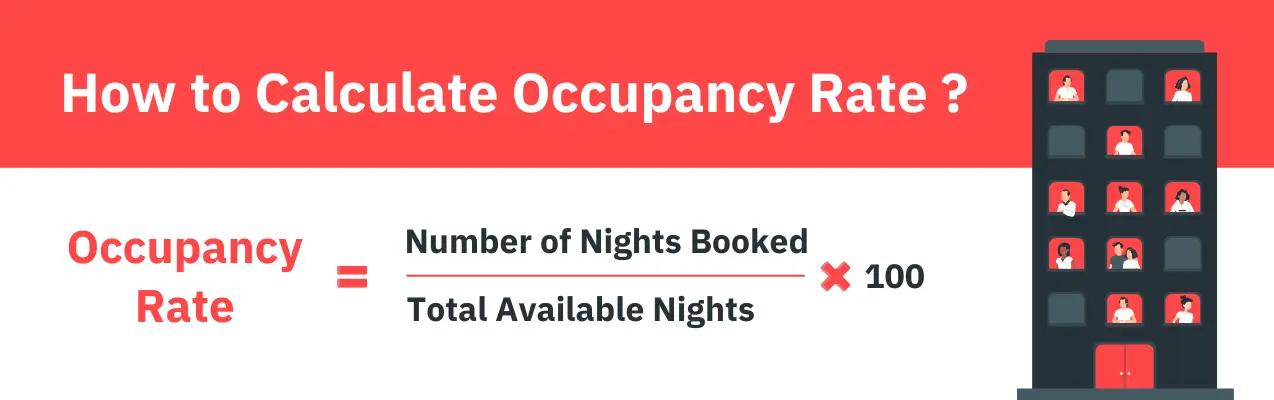
Occupancy Rate is booked nights divided by available nights, multiplied by 100. It measures calendar utilization. A 90% occupancy rate sounds great until you realize you discounted your way there and your actual revenue per available night is below market. The ADR vs occupancy vacation rental debate is one of the most common traps growing property managers fall into.
Net Profit Margin is where revenue meets reality. It's your revenue minus all costs, divided by revenue. A PM can have excellent ADR and RevPAR but terrible margins if cleaning costs are high, OTA commissions are eating 18% of every booking, and maintenance keeps surprising them at year-end.
RevPAR (Revenue Per Available Room Night) is the integrating metric: ADR multiplied by occupancy rate. It's the single number that captures both pricing and utilization together, making portfolio comparison possible. Understanding RevPAR is essential for any serious vacation rental RevPAR optimization program.
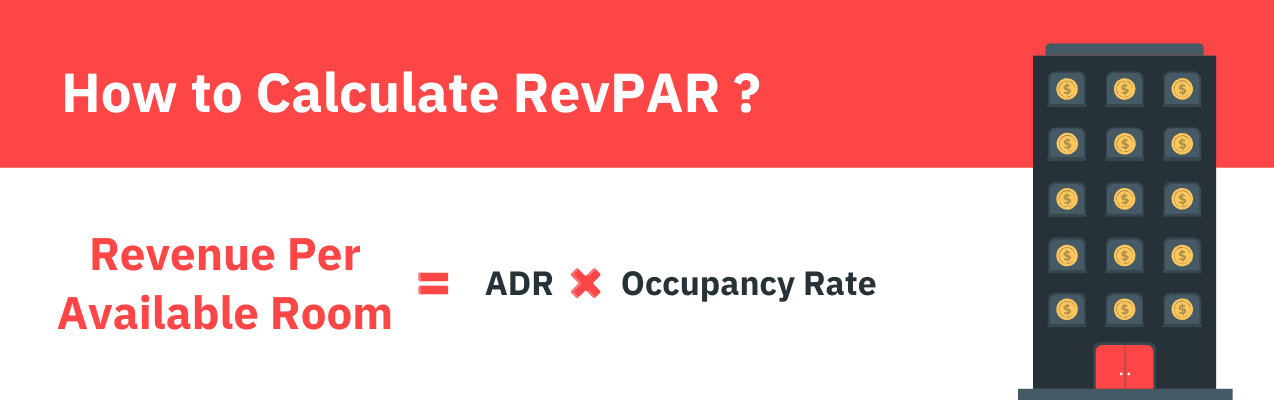
When you're managing 10, 20, or 40 properties, you cannot afford to eyeball each one individually. You need a single number that tells you, at a glance, whether a property is performing. That number is RevPAR, and it's central to any strong revenue management strategy for property managers.
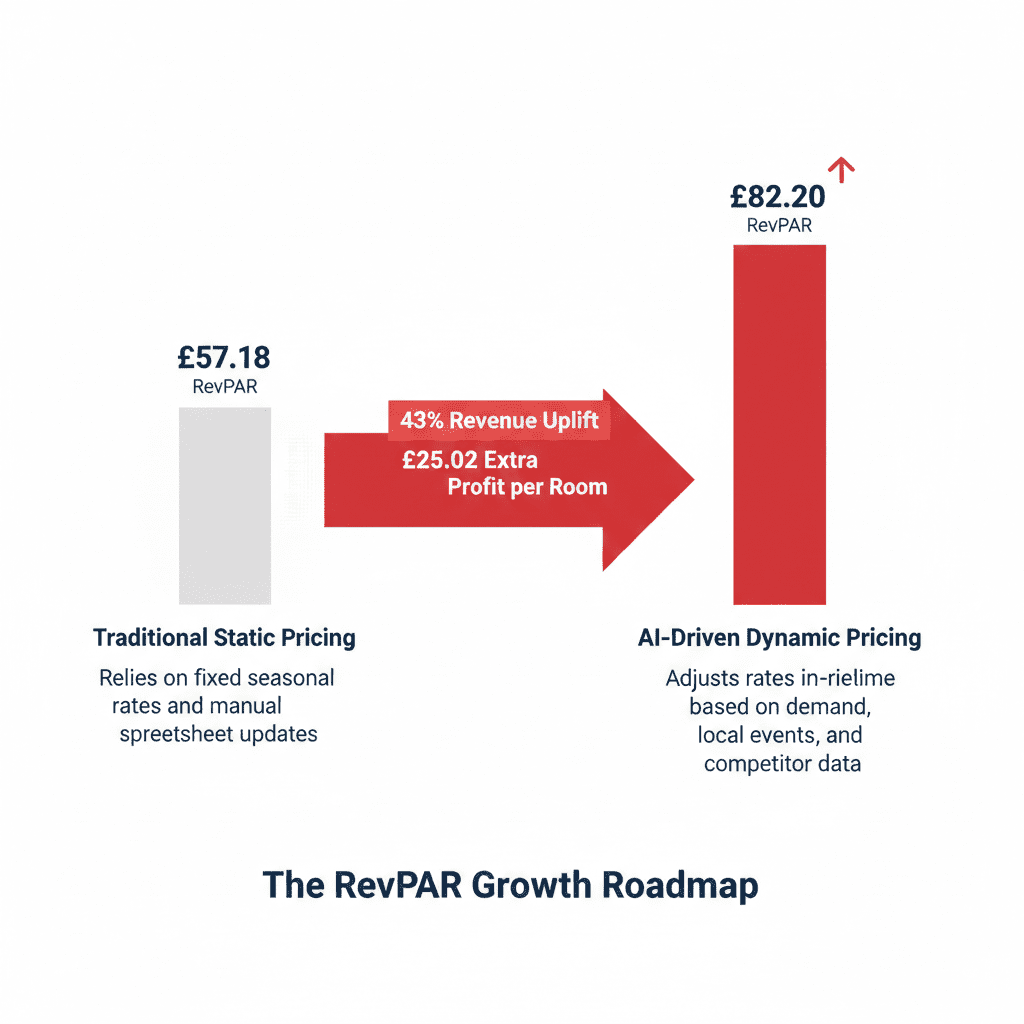
Here's why RevPAR works better than ADR or occupancy alone. Take two properties in your portfolio. Property A has an ADR of $250 and occupancy of 70% — RevPAR of $175. Property B has an ADR of $300 and occupancy of 55% — RevPAR of $165. On the surface, Property B looks like the better performer because the rate is higher. But Property A is actually earning more per available night. Without RevPAR, you'd likely over-attribute success to the wrong property.
Benchmarking RevPAR against the local market median is the next step. A property with RevPAR 10–15% above its submarket median is genuinely outperforming. A property more than 10% below warrants a pricing or positioning review. Market Dashboard data gives PMs the competitive benchmarks needed for vacation rental RevPAR optimization at the submarket level — not just the broad city average.
RevPAR trend lines matter as much as absolute numbers. Year-over-year RevPAR growth tells you whether you're gaining or losing ground against a changing market. PriceLabs Portfolio Analytics displays RevPAR alongside its components — ADR and occupancy — for every property simultaneously, enabling a quick weekly scan to identify outliers before they become problems. That's what revenue management for property managers looks like at scale.
The ADR vs occupancy vacation rental debate is a false choice. The goal is never to maximize either metric in isolation. The goal is to find the combination that maximizes RevPAR for each property at each stage of its demand cycle. The right balance shifts with the season — and any vacation rental revenue model strategy needs to account for that. Smart pricing tacticsfor independent properties follow the same seasonal logic.
Peak season: prioritize ADR. When demand is high, you can hold rates 40–100%+ above baseline without meaningful occupancy loss. Under-pricing your peak season is the single biggest missed revenue opportunity a property manager can make. Every dollar of ADR you leave on the table during peak translates directly to lower RevPAR for the year.
Shoulder season: balance ADR and occupancy. Modest rate adjustments of 10–25% below peak can maintain occupancy. Smart minimum-stay adjustments prevent gap nights that drag down your utilization numbers without generating enough revenue to justify short turnovers.
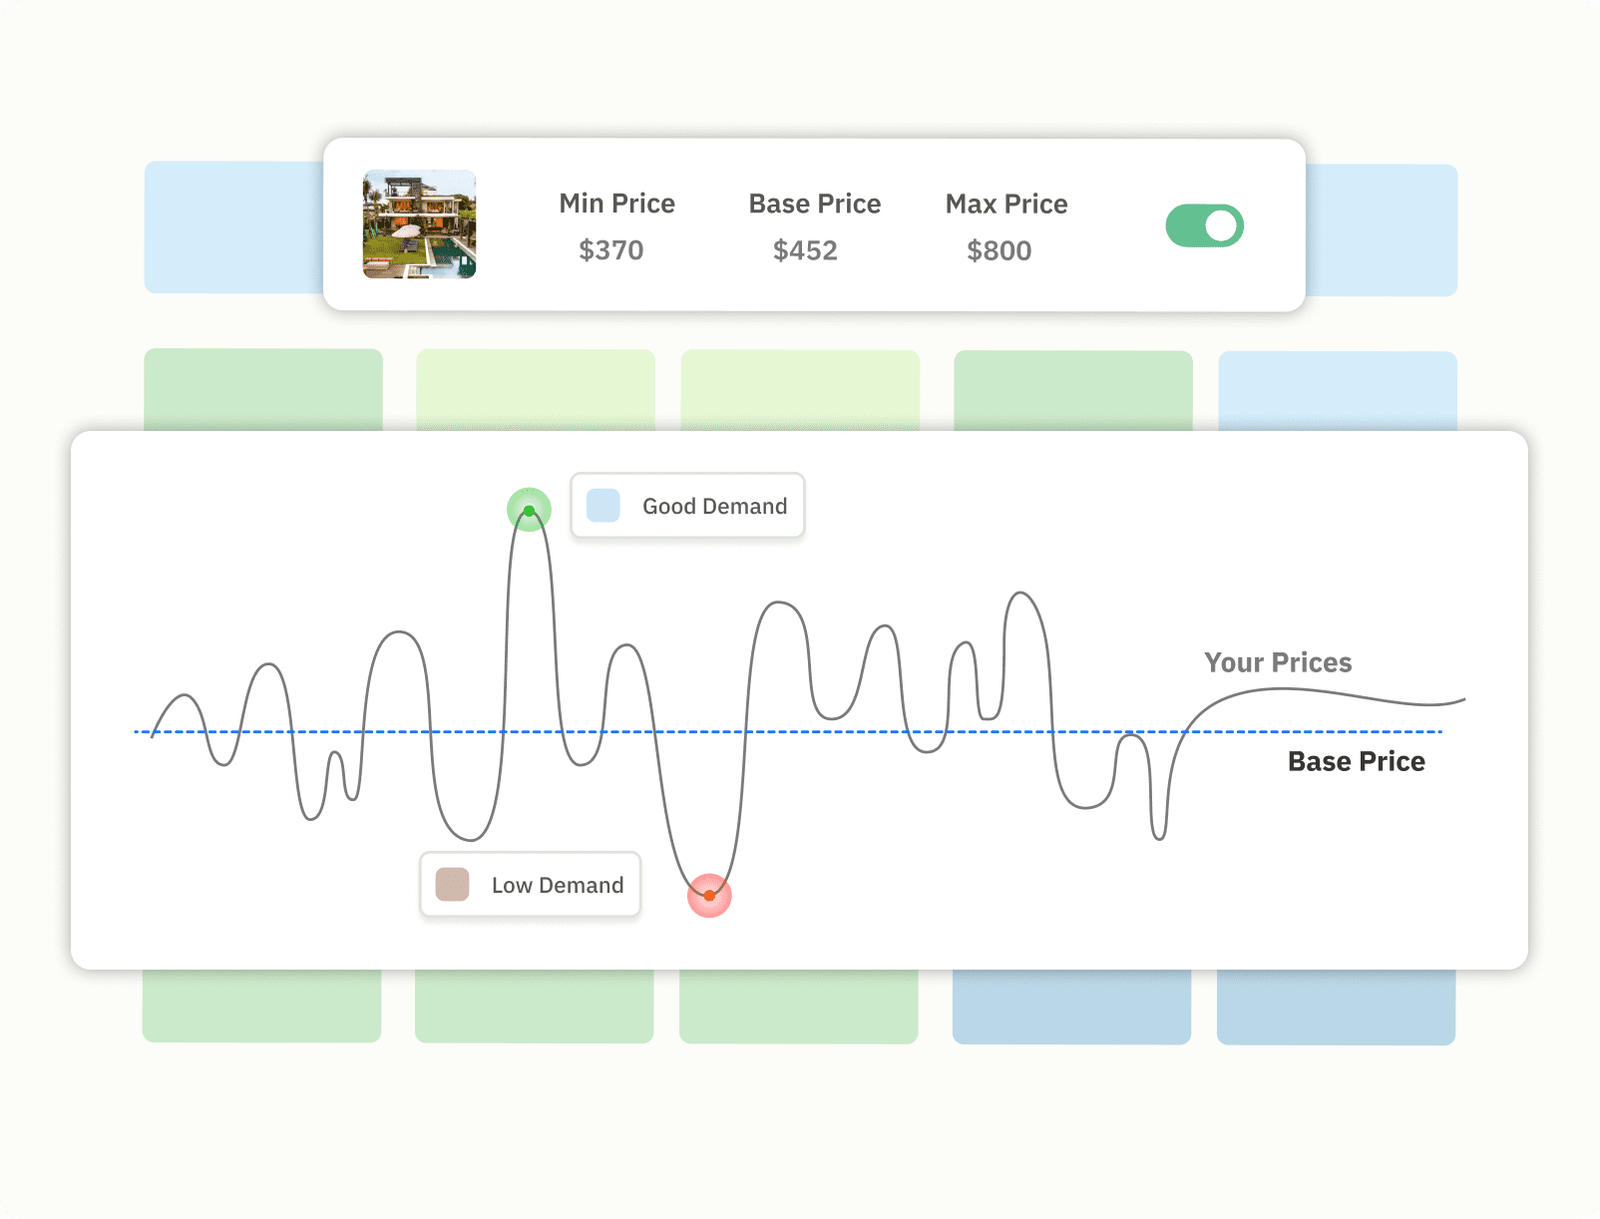
Off-season: prioritize occupancy — or pivot to monthly pricing. In genuine low-demand periods, a rate that fills the calendar beats an optimistic rate that produces empty nights. Dynamic pricing for property managers automates this seasonal balance continuously, adjusting rates based on real-time demand signals rather than a static calendar you update once a quarter.
The Hyper Local Pulse (HLP) Algorithm in PriceLabs is calibrated to find the RevPAR-maximizing price at each point in time — not just the highest rate or the most bookable rate. Custom pricing rules and overrides let PMs set season-specific constraints so the algorithm operates in the right mode for each period. Managing a property portfolio means having the right automation infrastructure behind each pricing decision.
Here's the uncomfortable reality: many Growing PMs know their ADR and occupancy rate. They've got RevPAR roughly figured out. But they have only a vague sense of their net margin — and that vagueness makes it impossible to know which properties are genuinely profitable versus which ones are generating gross revenue that evaporates into costs.
Short-term rental profit margin is the third leg of the revenue model, and it's the one that tells you whether you're actually building a business. Direct bookings are one of the most effective ways to improve your margin by eliminating OTA commissions on a portion of your revenue.
These are the core cost categories every PM must track per property:
The relationship between average length of stay and margin is one of the most underappreciated dynamics in STR management. A 2-night stay at $200/night generates $400 gross but incurs one cleaning at $100 — netting $300. A 7-night stay at $160/night generates $1,120 gross with one cleaning at $100 — netting $1,020. Same occupancy volume, dramatically different margin.
Smart minimum-stay adjustments in PriceLabs can be configured to prefer longer stays during periods where margin is most sensitive to turnover cost — automatically reducing the frequency of 1–2 night bookings that erode vacation rental profitability 2026 targets.
A scalable portfolio revenue model has four distinct layers. Each layer builds on the previous one, and together they give you the complete picture that most PMs never assemble. Analytics tools designed for property managers make this framework operational without requiring a team of analysts.
Layer 1 — Property-level baseline: For each property, document target ADR, target occupancy, RevPAR, gross revenue, and net margin by season.
Layer 2 — Portfolio-level dashboard: Aggregate all properties into a view showing total portfolio RevPAR, weighted average ADR, total booked nights, and gross versus net revenue. Identify your top and bottom performers. Revenue management strategy at the portfolio level starts with knowing which properties need attention.
Layer 3 — Market benchmarking: Compare each property's RevPAR to its local market median quarterly. Properties underperforming market by more than 10% need a pricing or positioning review.
Layer 4 — Scenario planning: Model what happens to portfolio revenue if ADR changes ±10% or occupancy shifts ±5%. Professional STR management at scale requires forward-looking data, not just historical reporting.
PriceLabs Portfolio Analytics provides the foundation for Layers 1 and 2 without manual spreadsheet work. Market Dashboards enable Layer 3 benchmarking. Pacing analysis and future pricing insights support Layer 4 by showing forward-looking demand versus historical pace.
Standard occupancy rate can understate performance if a chunk of your calendar was never actually available to rent in the first place — owner stays, maintenance blocks, or renovation periods all reduce bookable nights without reducing your reported inventory. Adjusted occupancy corrects for this by excluding non-revenue-generating days from the calculation:
Adjusted Occupancy Rate = (Paid Guest Nights ÷ Available Guest Nights, excluding blocked days) × 100%
This matters most for portfolios where a meaningful share of properties have recurring owner-use blocks — comparing raw occupancy across such a portfolio can make a genuinely well-performing property look weaker than it actually is, simply because part of its calendar was never for sale.
A revenue model is only as good as the cadence you use to act on it. This should take 30–60 minutes — not half a day. Automation infrastructure is what makes this timeline realistic for a dynamic pricing property manager.
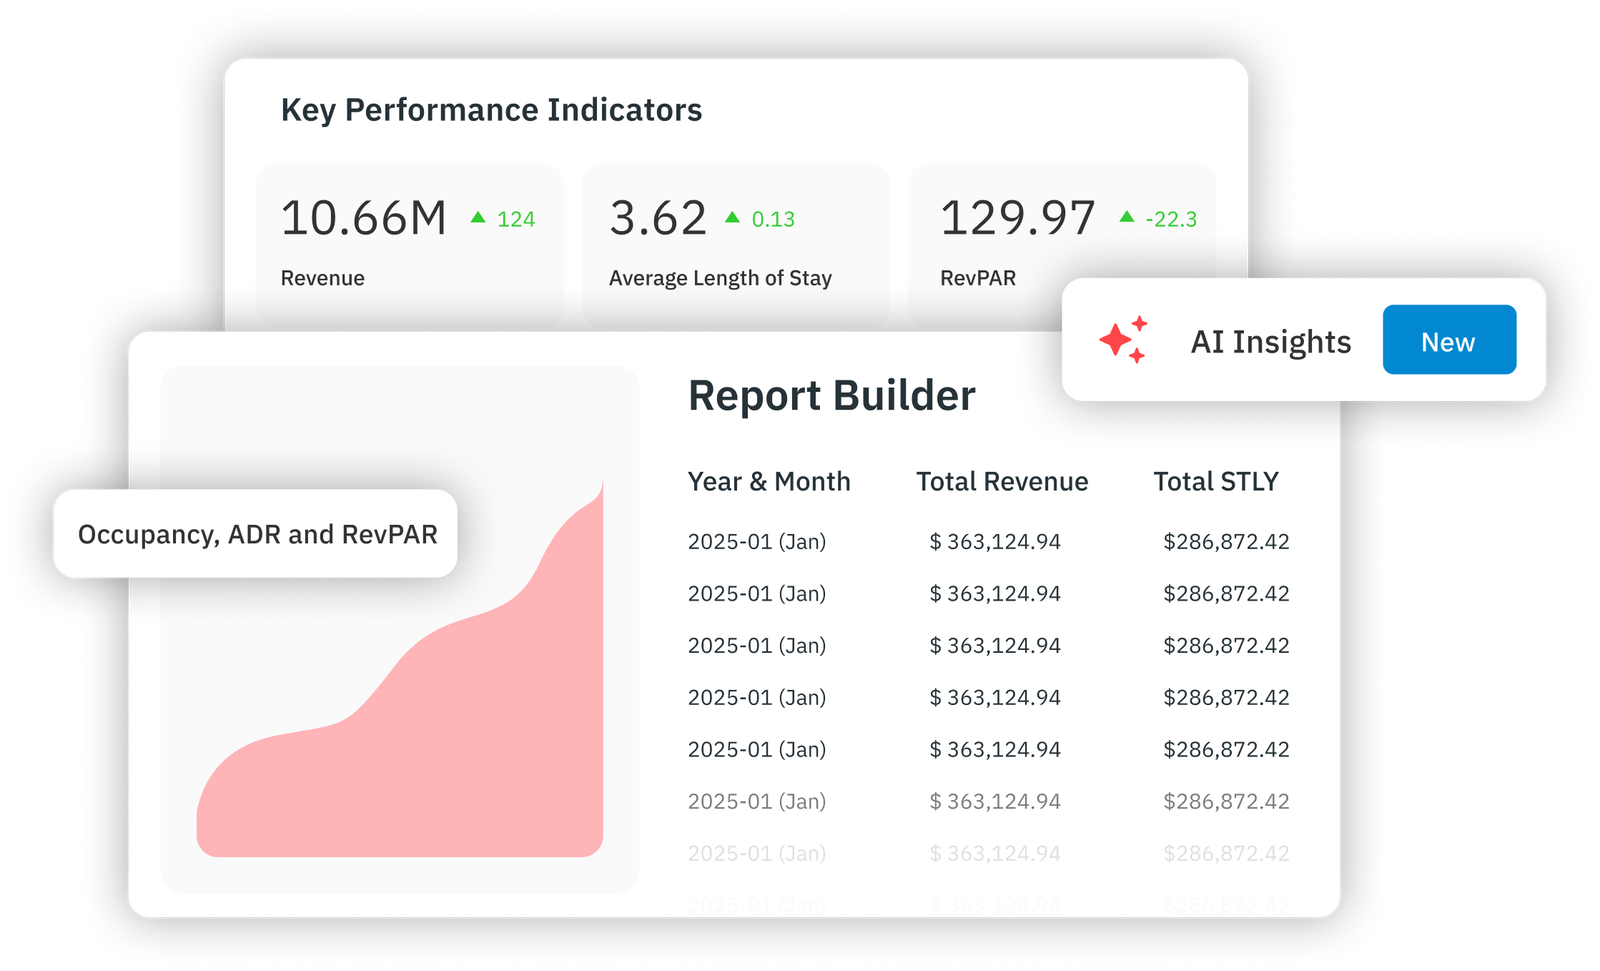
Your owners want to see the revenue data, not just trust your instincts. A structured monthly review gives you the numbers to back up every pricing decision. The vacation rental revenue model strategy you build is also the evidence base you use to justify every recommendation to property owners.
ADR (Average Daily Rate) measures the average revenue earned per booked night. Occupancy rate measures the percentage of available nights that are booked. RevPAR (Revenue Per Available Room Night) combines both by multiplying ADR by occupancy rate. In a complete vacation rental revenue model strategy, all three must be tracked together.
Neither in isolation — optimize for RevPAR, which balances both. In peak season, prioritize ADR. In shoulder and off-season, shift priority toward occupancy. Dynamic pricing automates this balance continuously.
A well-managed short-term rental should target a net profit margin of 20–40% after all costs: OTA commissions (15–20% of gross), cleaning and turnover, maintenance reserve (5–10% of gross), utilities, and management overhead.
Compare each property's RevPAR against the market median for its specific submarket — not the broad city or regional average. A property with RevPAR 10–15% above the submarket median is outperforming; one more than 10% below warrants a pricing or positioning review.
Dynamic pricing ensures that each property's ADR is continuously calibrated to capture peak demand premiums and fill shoulder and off-season periods at competitive rates. Properties using dynamic pricing consistently earn 20–40% more annual revenue than statically priced competitors.
Start by identifying your bottom-performing properties by RevPAR relative to their local market median. Address pricing issues through dynamic pricing calibration, positioning issues through listing optimization, and cost issues through operational efficiency improvements such as longer stays, direct bookings, and maintenance reserve management.
Building a complete vacation rental revenue model strategy means refusing to optimize in isolation. ADR tells you whether you're pricing right. Occupancy tells you whether guests are choosing you. RevPAR tells you whether both are working together. And margin tells you whether the revenue you're generating is turning into profit. Growing Property Managers who track all four — and have the automation infrastructure to act on what the data tells them — consistently outperform those chasing any single metric.
For the full breakdown of how RevPAR combines these metrics, see our guide to calculating RevPAR.
Want to learn what PriceLabs can do for you? See for yourself with a free trial. Get started now!