Table of Contents
Updated : Mar 17, 2025
Are you ready to set up your revenue strategy for 2025? Let’s explore how PriceLabs has already aligned your pricing with the latest market trends to match local demand. And, of course, we’ll guide you on making adjustments if you’d like to fine-tune these recommendations.
1. View Your 2025 Prices and Compare with the Local Market Using the Neighborhood Data tab
The Future Prices graph in the Neighborhood Data tab shows your listing’s daily rates for 2025, comparing them to the broader market with percentile markers to indicate whether your prices are in the affordable, average, or premium range. PriceLabs has already factored in demand, seasonality, and other elements to adapt your pricing, helping you track how your rates evolve throughout the year and stay aligned with market trends.
If you find the graph complex, simply click the AI Insights button. AI Insights makes the Future Prices graph easier to interpret by highlighting essential details, such as whether your prices are above or below market averages, identifying demand spikes, and flagging dates where adjustments could be useful. Instead of analyzing every line, you’ll see clear insights to help you focus on impactful changes.
You can also refine the market comparison by selecting specific property types. For example, rather than viewing the entire market, you could narrow the focus to 2- and 3-bedroom homes for a more targeted view. This helps you identify key 2025 trends and see how PriceLabs’ Hyper-Local Pulse algorithm has adapted your listing’s prices. By default, PriceLabs keeps your far-out prices higher to help you get the best possible rates for future bookings. You can customize this and other prices using the approach mentioned below.

2. When to Make Adjustments Using the Future Prices Chart
While PriceLabs has set your prices based on market trends, you may still want to make adjustments in certain cases:
- For Specific Dates: If your overall pricing looks good but there’s an event, like a concert, that may need special attention, you can override PriceLabs’ recommendations. Simply go to your Pricing Calendar, select the relevant dates, and enter your own prices to reflect the event.
- For a Full Base Price Reassessment: If your entire pricing strategy seems off, it’s worth checking if your Base Price is still accurate. For example, new competition in your area may require adjustments to your rates. PriceLabs assists with this by sending a nudge message in your Pricing Dashboard when a change is recommended, along with a suggested new Base Price. Simply click to apply it if needed.

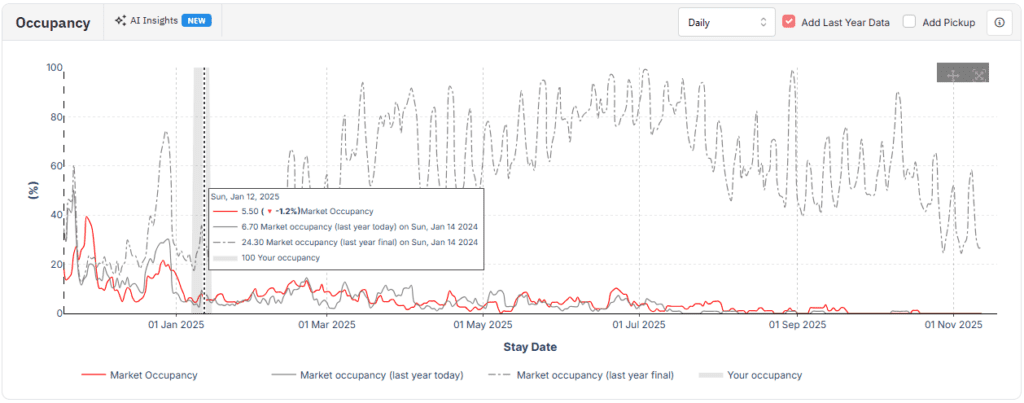
3. Track Your Occupancy with the Occupancy Graph
The Occupancy Graph helps you see how full your property is each day. Occupancy is the percentage of nights booked—0% if you have no bookings, and 100% if fully booked. This graph displays your occupancy (gray line) alongside the market’s occupancy (red line) so you can compare your bookings with similar listings nearby.
You can also add last year’s data (dashed line) to check if you’re doing better or worse than in 2024, providing valuable “pacing data” to assess your progress. Here again, AI Insights simplifies these 2025 trends by highlighting key points, so you can quickly understand your position without having to analyze every detail.
4. Adjust Minimum-Stay Rules to Boost Bookings
You can also set minimum-stay rules for specific dates. For example, you might use a Date-Specific Override (DSO) to change minimum stay requirements during the low season to attract more bookings. If you’re considering changes for the entire year, PriceLabs provides minimum-stay recommendations to help guide your overall strategy, ensuring you’re using the most effective rules to increase occupancy and revenue.

5. Get a Big-Picture View with the Market Dashboard
The Market Dashboard offers insights into broader market trends by analyzing up to 10,000 properties in your area. This tool gives you a clear view of upcoming pricing and occupancy trends, listing growth, popular amenities, and more, allowing you to track larger market shifts. Unlike the hyper-local focus of Neighborhood Data, the Market Dashboard covers a wider area, making it perfect for annual planning and helping you adjust your pricing and offerings to stay competitive as the market changes.

Conclusion: Let PriceLabs Do the Heavy Lifting for 2025
With PriceLabs’ algorithm already handling most of the adjustments for 2025, you don’t have to worry about making constant changes. The core pricing updates are in place, tailored to reflect demand, seasonality, and local trends. By checking the graphs and insights in your account, you gain transparency into why PriceLabs is recommending certain prices. These tools allow you to understand the “why” behind the recommendations, so you feel confident in your pricing strategy and can step in only when you see a need for small tweaks.