Get started with PriceLabs now!
Want to learn what PriceLabs can do for you? See for yourself with a free trial. Get started now!
Occupancy rate is the percentage of available nights your short-term rental actually gets booked, and on its own it only tells half the revenue story: it's ADR and occupancy together that determine whether a booked-out calendar is actually a profitable one. Getting the occupancy calculation right matters more than it seems: a formula that quietly includes or excludes the wrong nights can make a property look far better or worse than it actually is.
Occupancy rate is the share of available nights that were actually booked over a given period. If your rental was available for 30 nights in a month and booked for 18 of them, your occupancy rate is 60%. It applies the same way whether you're looking at a single listing, a hotel room, or an entire portfolio, and it's the clearest signal of how well a property is actually attracting bookings, as opposed to just getting views. It's also just one of several KPIs worth tracking side by side rather than in isolation.
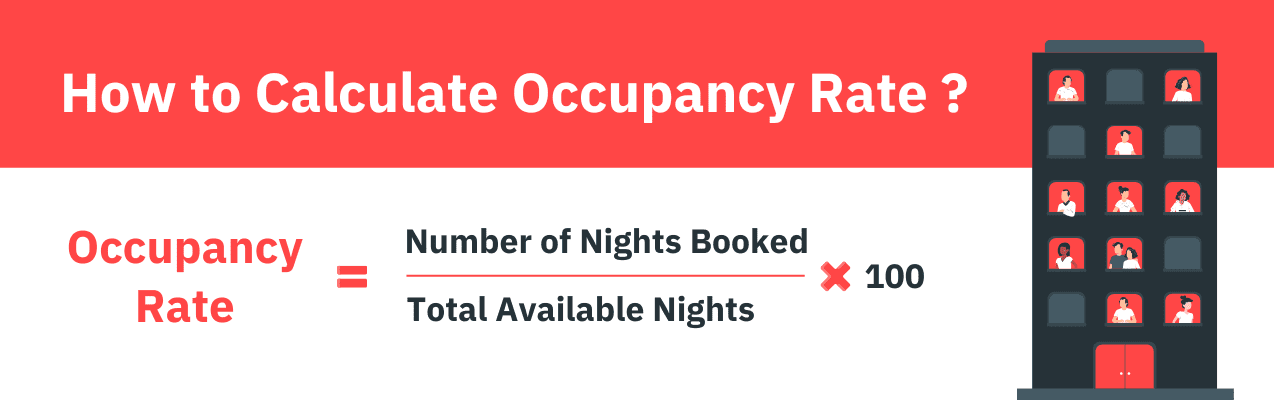
The basic formula is:
Occupancy rate (%) = (nights booked ÷ total available nights) × 100
Booked for 20 nights out of 30 available gives you (20 / 30) × 100 = 66.7%.
The tricky part isn't the formula, it's deciding what counts as "available." There are two common approaches:
Say your rental has 30 calendar nights this month, but you blocked 5 for personal use and 3 for maintenance. Your guest-available nights are 30 − 8 = 22. If you booked 15 of those, your guest occupancy rate is:
(15 ÷ 22) × 100 = 68.2%
That's a meaningfully different number from a flat 50% (15 ÷ 30) using total calendar nights, and it's the version that actually reflects how well the property performed on the nights it could have earned money.
A perfect occupancy rate sounds like the goal, but it isn't always one. Full occupancy at a heavily discounted rate, especially from a single long-term booking, can leave more money on the table than a lower occupancy rate at a stronger nightly price.
| Property | Occupancy rate | ADR | Revenue per available night |
|---|---|---|---|
| Your property | 100% | $120 | $120 |
| Competing property | 75% | $180 | $135 |
Even at full occupancy, your revenue per available night comes in below the competitor's, because their higher rate more than makes up for the empty nights. Occupancy alone never tells the whole story; pairing it with ADR and RevPAR is what actually shows whether a high occupancy rate is translating into real revenue.
Average occupancy rates vary a lot by location, property type, and season. High-demand tourist destinations often clear 70% during peak season, while quieter markets or off-peak periods more commonly land in the 50-60% range. As a rough benchmark, 65% or higher is generally solid, though the number that actually matters is how you compare to similar listings in your specific market rather than a national average. Market Dashboards show real local benchmarks by neighborhood and comp set, so you're checking your rate against what's actually happening nearby.
Once you know where you stand, the levers that move the number are pricing, listing quality, and how you handle the calendar around gaps and seasons; a full breakdown of specific tactics covers this in depth, but a few of the highest-leverage ones:
| Method | Formula | Best for | Trade-off |
|---|---|---|---|
| Total calendar nights | (booked nights ÷ total calendar nights) × 100 | A broad, simple view of overall usage | Understates performance if you block a lot of nights |
| Guest-available nights | (booked nights ÷ nights available to guests) × 100 | A revenue-focused view of earning potential | Requires clean tracking of blocked and maintenance days |
If you're managing more than a listing or two, Portfolio Analytics rolls occupancy up across every property in one view, which makes it far easier to spot which specific listing is dragging down an otherwise healthy portfolio average.
Standard occupancy rate counts every calendar night, including ones you've blocked yourself. Guest occupancy rate excludes owner and maintenance blocks, counting only nights that were actually open for booking, which gives a clearer picture of real earning nights.
Low occupancy often signals your price is too high or the listing isn't converting; high occupancy at a low rate suggests there's room to raise prices. Reading occupancy alongside ADR is what tells you which situation you're actually in.
Not necessarily. Full occupancy can mask weak revenue if the rate behind it is too low or driven by one long, discounted booking. Check occupancy against ADR and revenue per available night before treating it as a win on its own.
A portfolio-level view that rolls up occupancy, ADR, and revenue across every property makes it possible to spot an underperforming listing quickly, rather than checking each calendar individually.
Monthly is the minimum for spotting real trends. If you're actively adjusting pricing, checking weekly, or using a tool that tracks it automatically day to day, gives you a much faster read on whether a change is working.
Want to learn what PriceLabs can do for you? See for yourself with a free trial. Get started now!