Using internal PriceLabs data for Lahaina, we can see in numbers what many hosts on the ground have been feeling since the August 2023 wildfires: a market that was shocked almost overnight, then slowly rebuilt with fewer listings and fewer booked nights, yet surprisingly resilient pricing power.
This article walks through what changed across supply, demand, revenue, and pricing, and what any host in a disruption-hit or policy-constrained market can learn from Lahaina’s data story.
How we’re looking at the data
For this analysis, we used monthly data for Lahaina across three 12-month periods:
2022–23 – Pre-wildfire baseline
2023–24 – The first year after the wildfires
2024–25 – The second year of adjustment and early recovery
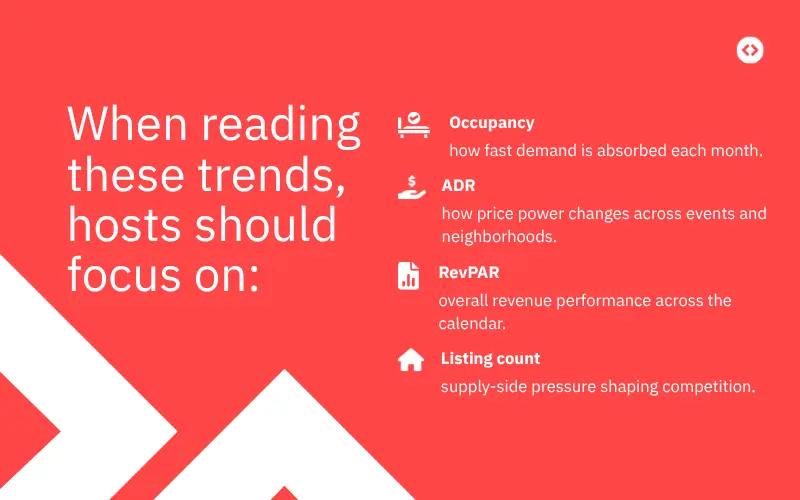
When reading this article, this is what you want to focus on
1. A massive supply shock: Lahaina’s listings were cut in half
The first and clearest impact of the wildfires is on supply.
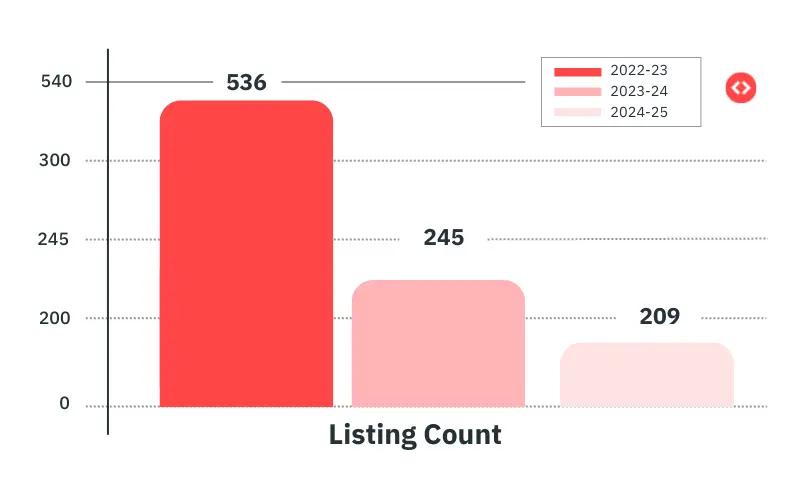
Across the 2022–23 period, Lahaina averaged about 536 active listings. In 2023–24, that dropped to roughly 245 listings – a 54% drop in available supply. By 2024–25, listings fell further to around 209, a 61% decline from the pre-wildfire year.
Listing count in the Lahaina short-term rental market
If you zoom into specific months, the contraction looks even starker:
In August, listings went from 514 (2022–23) → 559 (2023–24) → 192 (2024–25).
For much of the year, the 2024–25 supply is 60–65% lower than before the wildfires.
This tells us two important things:
Lahaina is operating with a structurally smaller STR inventory. Damage, regulations, and long-term housing priorities have all contributed to fewer short-term rentals.
Any host who is still active is now operating in a very different competitive landscape. You’re no longer competing in a dense, tourism-heavy market with hundreds of similar listings around you; you’re in a smaller, more supply-constrained environment where each active listing matters more.
2. Demand collapsed too – booked nights are still ~85% below pre-fire levels
When supply shrank, demand didn’t simply “redistribute”. Bookings also fell sharply.
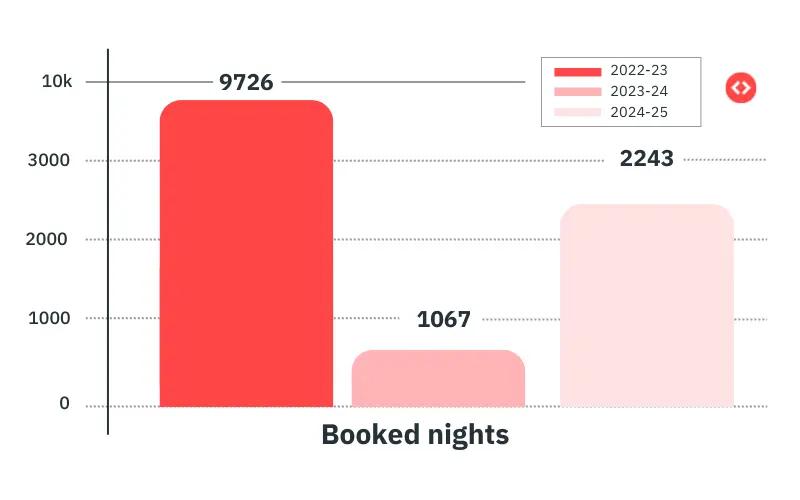
Average booked nights per month dropped from about 9,486 (2022–23) → 1,914 (2023–24) → 1,349 (2024–25)
Booked nights trends in the Lahaina short-term rental market
That’s roughly:
-80% booked nights in 2023–24 vs pre-wildfire
-86% in 2024–25 vs 2022–23
So even as we move into the second year after the wildfires, total booked nights are still less than 20% of what they used to be.
This reflects:
Fewer properties operating
Lower overall tourism demand in Lahaina
Longer-term stays and housing priorities are taking precedence over STR bookings
Yet, this doesn’t mean every active listing is “empty”.
3. Occupancy dipped hard – then stabilised at a new normal
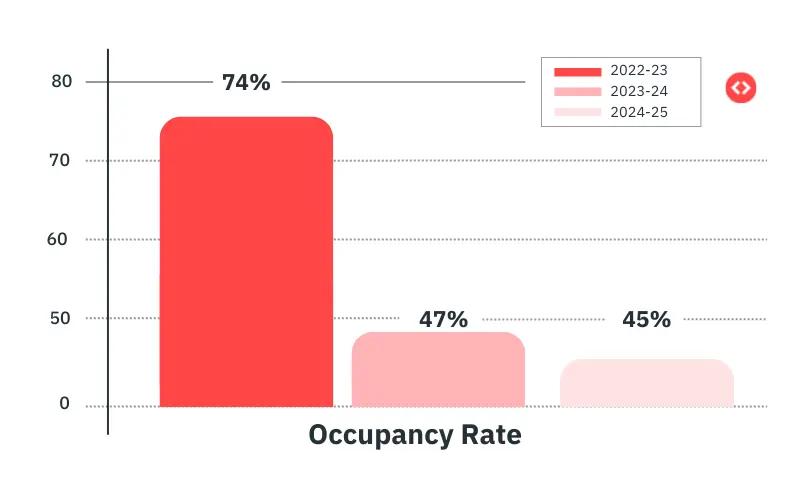
Despite the collapse in booked nights, the occupancy rate for active listings tells a more nuanced story.
And in some months, RevPAR in 2024–25 actually exceeds 2022–23:
March 2024–25: RevPAR ~$534 vs $399 in 2022–23
April 2024–25: $413 vs $344
July 2024–25: $489 vs $351
So even though the total pie is much smaller, for the listings that are still active and well-positioned, earnings per available night are now close to (or even above) pre-wildfire levels in several months.
This is an important takeaway for hosts:
In a disrupted market, macro revenue can be down, but unit-level performance can still be healthy if you stay active, visible, and smart with pricing.
5. ADR surged: fewer listings, higher rates
RevPAR doesn’t recover by magic. A key driver here is ADR.
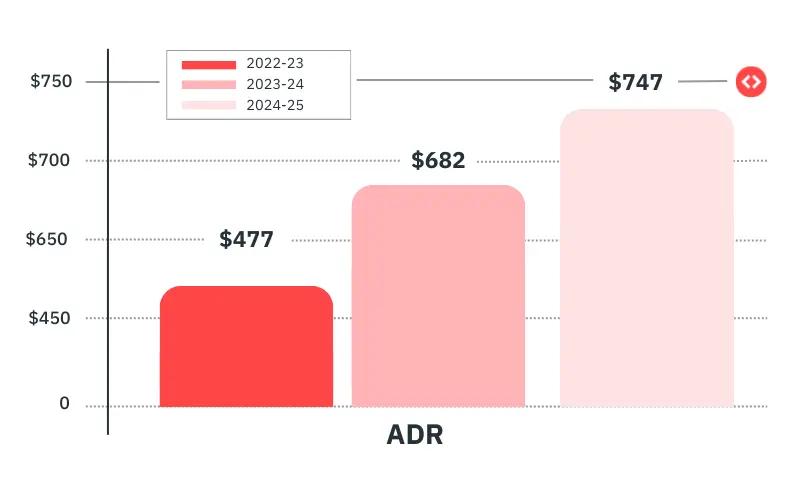
Average ADR in 2022–23: ~$477
2023–24: ~$682 (+43% vs baseline)
2024–25: ~$747 (+57% vs baseline, +9–10% vs 23–24)
ADR trends in the Lahaina short-term rental market
Many months show ADR jumping 40–70% compared to 2022–23. This reflects:
Hosts raising rates to cover higher costs and risk
6.1. Expect a multi-year, not single-season, adjustment
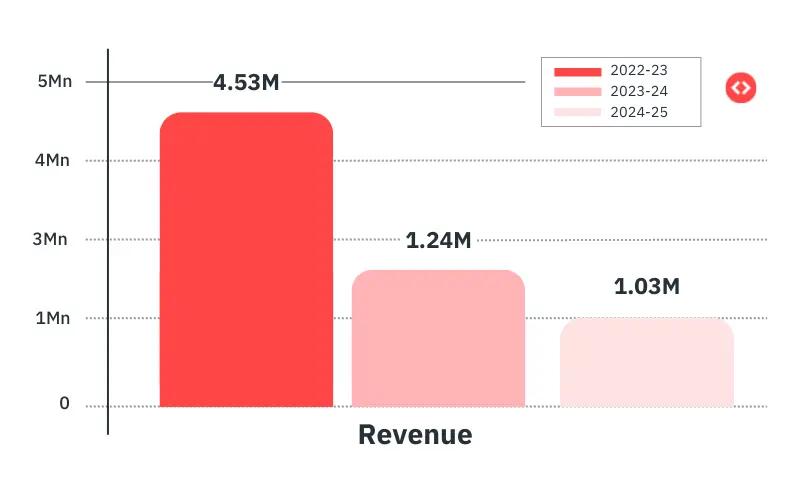
Lahaina’s booked nights are still ~85% below pre-fire levels even in 2024–25, and total revenue remains ~75% down. Recovery isn’t linear or quick.
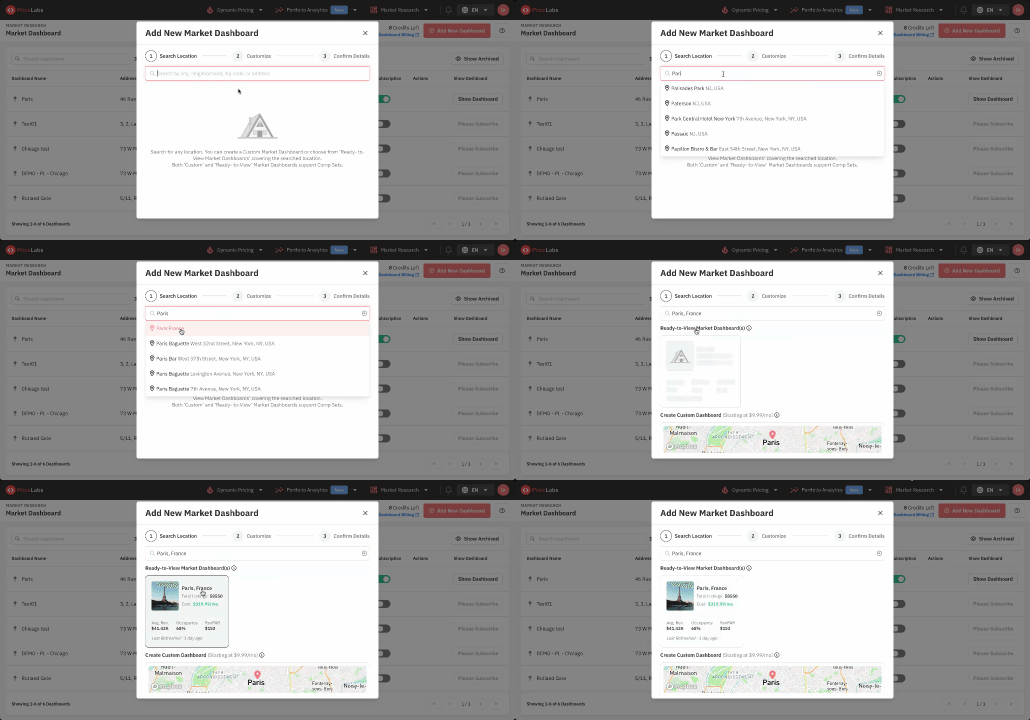
What you can do with PriceLabs: Use Market Dashboards and tools like the PriceLabs STR Index (if available in your region) to track year-over-year changes in:
Dynamically Price Your Property and Get FREE Custom Reports Tailored To Your Property!
Use PriceLabs Dynamic Pricing to competitively and dynamically price your property according to demand shifts and analyze past performance to set a strong pricing strategy for your property.
This tells you if you’re in a shrunken, stabilised, or recovering phase.
Step 2: Reset your pricing assumptions
Given Lahaina-style patterns, ask:
Is supply down more than demand? → You may have more pricing power than your occupancy alone suggests.
Has ADR climbed significantly? → Don’t anchor too low, but avoid overpricing if demand is still fragile.
In PriceLabs:
Start with recommended dynamic prices.
Adjust your base price using their base price help tools (where available).
Use minimum-stay settings to balance occupancy (2–3 nights) with cleaning/turnover costs.
Step 3: Use rules and overrides to manage uncertainty
Apply last-minute discounts more intelligently in shoulder or uncertain periods.
Use Far-out premiums for dates 6–9 months ahead if your market typically books early but now has fewer listings.
Add event- or date-level overrides for known tourism events that might return ahead of full market recovery.
Step 4: Monitor performance vs the market
Every 1–2 months:
Compare your ADR, occupancy, and RevPAR vs the market median with PriceLabs’ analytics.
If you’re lower on ADR but similar occupancy: → You can likely raise rates slightly.
If you’re higher on ADR but have much lower occupancy: → Consider more aggressive discounts or shorter minimum stays until the demand base grows.
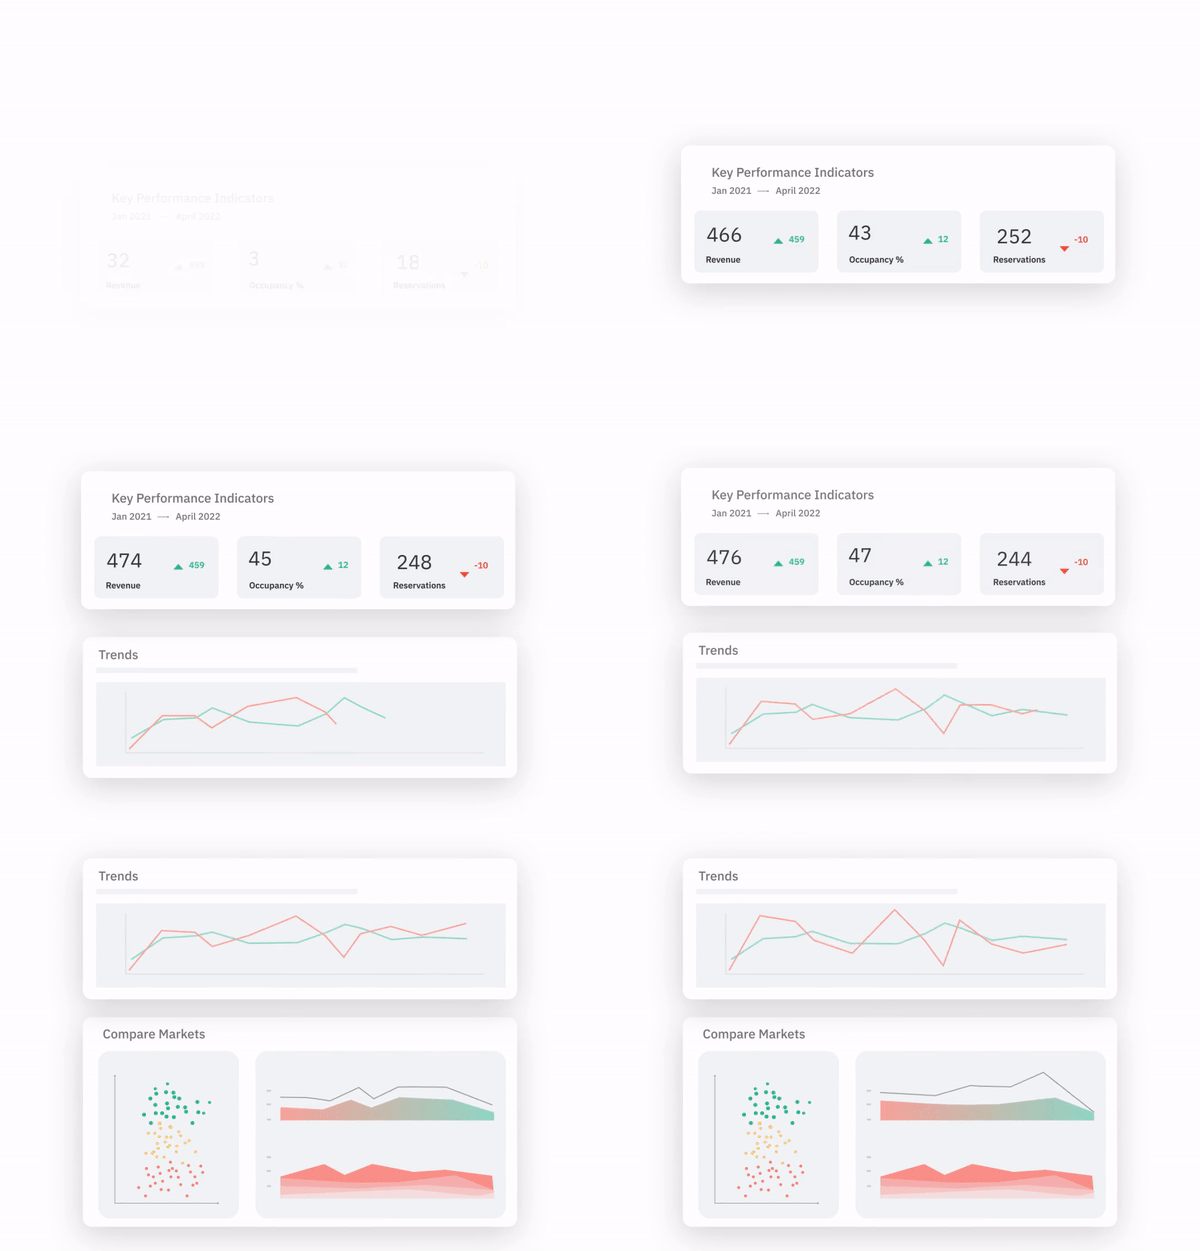
Use Portfolio Analytics to understand your property’s performance
Conclusion: Lahaina shows how fragile – and flexible – STR markets can be
The Maui wildfires turned Lahaina’s short-term rental market into a case study in shock, contraction, and recalibration:
Supply: ~60% fewer listings than pre-wildfire
Demand: ~80–85% fewer booked nights
Revenue: ~70–75% lower total revenue
Pricing: ADR up >50%, RevPAR nearly back to pre-fire levels for active listings
For hosts, the lesson is clear:
You can’t control disruptions, but you can control how quickly you adapt your pricing and strategy.
Tools like PriceLabs help you base those decisions on real data, not guesswork — whether you’re in Lahaina or any other market going through big structural change.
Frequently Asked Questions
1. How much did the short-term rental supply drop in Lahaina after the Maui wildfires?
Based on PriceLabs market data, active listings in Lahaina dropped by ~60% between 2022–23 and 2024–25. The steepest decline occurred immediately after August 2023, and supply has remained significantly constrained since then.
2. Has tourism demand recovered in Lahaina since the wildfire?
Not fully. Booked nights are still 80–85% lower compared to pre-wildfire levels. While a few months show early signs of recovery, overall demand remains far below 2022–23 levels.
3. Why is RevPAR almost back to pre-wildfire levels even though bookings fell?
RevPAR has recovered mainly because ADR increased 40–70% post-wildfire. With fewer listings available and higher operating costs, active hosts have been able to command higher nightly rates, offsetting the decline in occupancy.
4. Are Lahaina hosts charging significantly higher nightly rates today?
Yes. ADR in Lahaina increased from an average of $477 (2022–23) to $747 (2024–25) — a ~57% increase. This aligns with lower competition, higher risk, and increased operational costs.
This market shift still connects to the fundamentals in our complete guide to becoming an Airbnb host.
Get started with PriceLabs now!
Want to learn what PriceLabs can do for you? See for yourself with a free trial. Get started now!