
Get started with PriceLabs now!
Want to learn what PriceLabs can do for you? See for yourself with a free trial. Get started now!
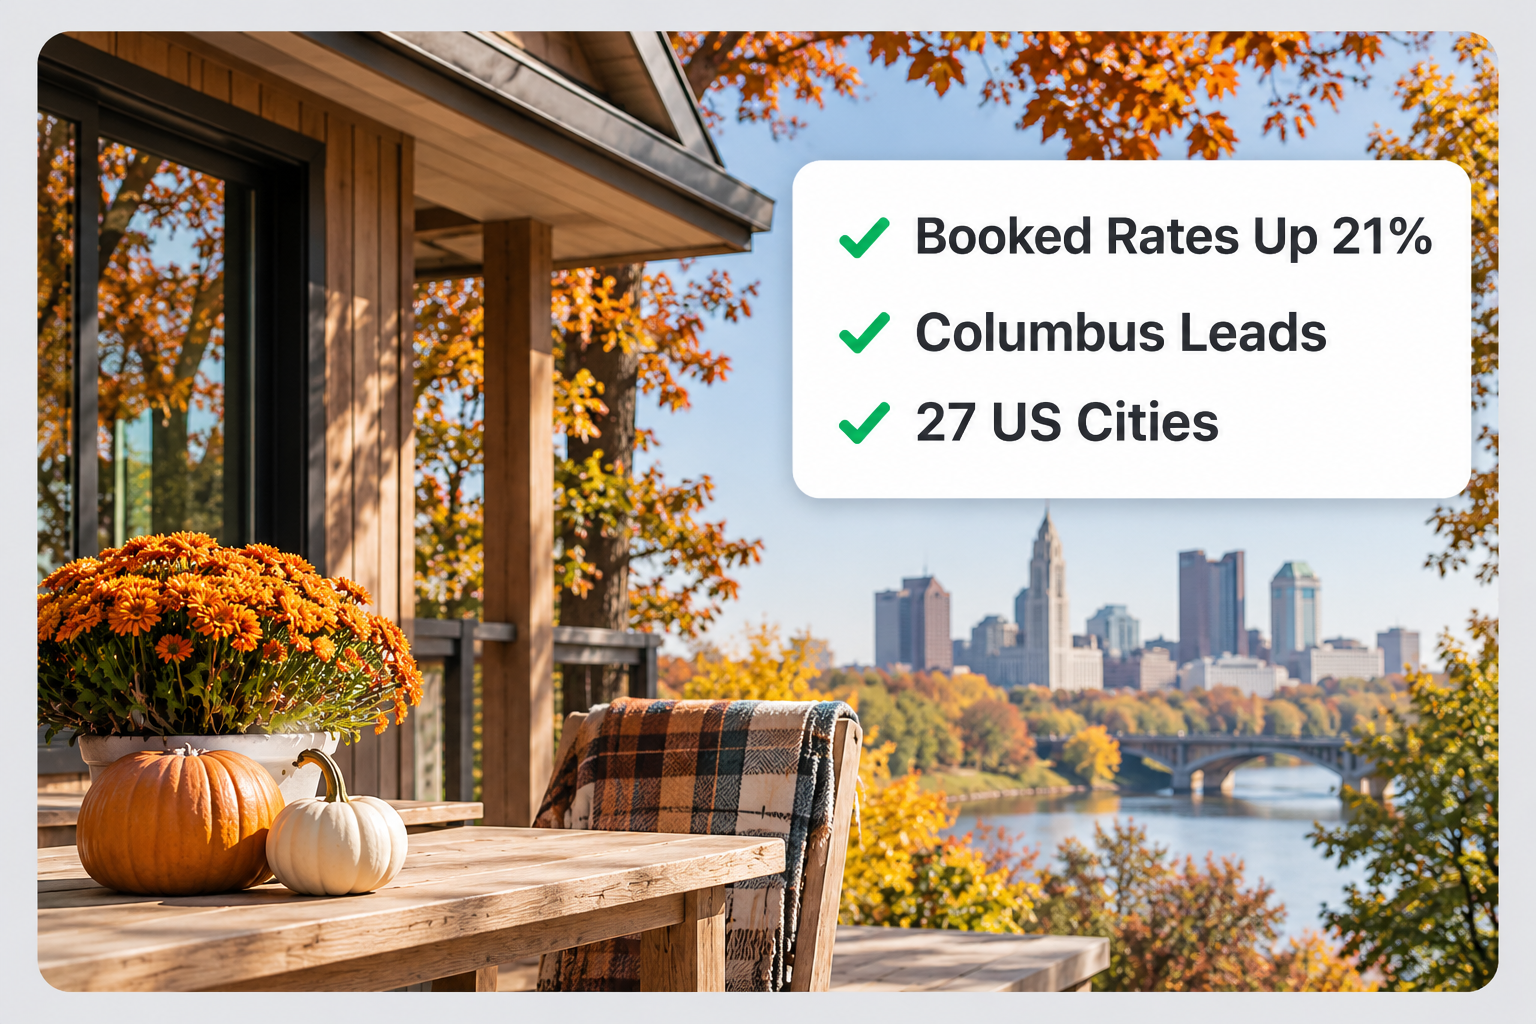
Thanksgiving is one of the busiest travel weeks of the year in the US, and for short-term rental hosts it is often booked well in advance. To see how this year compares with last, we looked at bookings already on the books for Thanksgiving week 2026 across 27 major US cities and compared them with the same point before Thanksgiving 2025.
Across all 27 cities, guests are paying more per night than they were a year ago. Average booked nightly rates are up 21% year over year. Booked nights are up 4% overall, but that growth is uneven. Nights rose in 18 cities and fell in the other 9.
Below, we go through what the data shows, where the biggest changes are, and what hosts can take from it ahead of the holiday.
We looked at nights booked for Wednesday to Saturday of Thanksgiving week: November 25 to 28 in 2026, and November 26 to 29 in 2025. The data was collected on October 28, 2026, and compared with bookings made as of October 28, 2025. It is based on public data from Airbnb, Vrbo and Booking.com.
This is a sample of 27 major cities, not a national figure. Bookings are still coming in, so final numbers for the holiday will differ.
The overall figures use combined totals across the 27 cities. Booked-night growth compares total booked nights in each year. Average daily rate (ADR) growth compares total booking revenue divided by total booked nights in each year.
Columbus, Ohio, had the largest increase in both measures. Booked nights are up 56% compared with last Thanksgiving, and the average booked nightly rate is up 61%, to $272.
The timing lines up with the Ohio State–Michigan game. This year it is played at Ohio Stadium in Columbus, with kickoff at noon on Saturday, November 28, which falls inside the period we analyzed. Last year the game was in Ann Arbor.
Columbus shows how much a single event can change a city's numbers. In a year without a home game, Columbus would look like many other mid-sized markets. With one, it tops the sample on both bookings and price.
After Columbus, the strongest growth in booked nights is in Detroit (+35%), Houston (+19%), and New Orleans and Nashville (both +17%). These five cities saw double-digit growth in both booked nights and rates.
Nine cities have fewer nights booked than at this point last year: Phoenix (-1%), Dallas (-2%), Las Vegas (-6%), New York City (-7%), Denver (-8%), Seattle (-8%), Kansas City (-13%), Los Angeles (-14%) and Austin (-14%).
Cities in the same state can move in opposite directions. In Texas, Houston is up 19% on booked nights, Dallas is roughly flat at -2%, and Austin is down 14%. Regional trends are a useful starting point, but they don't replace looking at your own market.
Every city in the sample recorded a higher average booked rate than last year. The smallest increase was in Seattle (+7%) and the largest in Columbus (+61%). New York City (+39%) and San Francisco (+34%) were next.
Rates also rose in all nine cities where booked nights fell, in some cases by more than 20%. Las Vegas is up 28% on rate with booked nights down 6%. Phoenix is up 27% with nights down 1%. Denver and Los Angeles are both up 23%, with nights down 8% and 14%.
A higher average booked rate doesn't always mean every host raised prices. The average reflects which listings got booked, so a change in the mix of properties booked (for example, more larger homes for family groups) can also move it. This data describes what guests paid, not why.
New York City stands out. The average rate has risen to $226 per night while booked nights are down 7%. Active listings in the city are also down 16% year over year, in a market with strict local short-term rental rules. With fewer listings available, rates are higher even though fewer nights are booked.
New Orleans is the most expensive city in the sample for Thanksgiving week, at an average of $329 per night. San Diego ($312) and Nashville ($277) follow. Seven cities average more than $250 a night, including Columbus and Phoenix (both $272), Los Angeles ($266) and San Francisco ($260).
At the other end, Salt Lake City has the lowest average rate at $124 per night, followed by Orlando ($147), Portland ($152), Houston ($154) and Minneapolis ($158).
Check your local event calendar for the holiday. Columbus shows how much one fixture can move demand. Football games, parades, concerts and conferences that overlap Thanksgiving week can change the picture for your city, and they don't repeat in the same place every year.
Compare your own pace with last year. With more than four weeks still to go when this data was collected, booking pace tells you more than final occupancy. If you are well ahead of last year, you may have room to hold rates. If you are behind, it is worth looking at why before cutting prices.
Don't read a falling booking count as a reason to discount. In every city where booked nights dropped, guests are still paying more per night than last year. Fewer bookings at a higher rate can still mean similar or better revenue.
Look beyond the city average. Neighborhood, property size and amenities matter. A large family home near downtown and a studio on the edge of the city won't follow the same curve.
Set rules for the dates around the holiday. Thanksgiving creates short gaps before and after the main nights. Minimum-stay settings and gap-night rules help you avoid unsold single nights next to fully booked weekends.
PriceLabs Market Dashboards let you track booking pace, occupancy and rates for your own market and compare them with last year, so you can see whether these trends apply to your area.
| City | Booked nights YoY | ADR 2026 (USD) | ADR YoY |
|---|---|---|---|
| Columbus | +56% | $272 | +61% |
| Detroit | +35% | $198 | +17% |
| Houston | +19% | $154 | +21% |
| New Orleans | +17% | $329 | +28% |
| Nashville | +17% | $277 | +17% |
| Orlando | +10% | $147 | +24% |
| Charlotte | +10% | $183 | +12% |
| San Diego | +9% | $312 | +15% |
| Chicago | +9% | $228 | +20% |
| Boston | +9% | $212 | +16% |
| Salt Lake City | +8% | $124 | +12% |
| Atlanta | +8% | $207 | +16% |
| Minneapolis | +7% | $158 | +16% |
| Portland | +6% | $152 | +8% |
| Miami | +5% | $229 | +24% |
| Washington | +5% | $201 | +13% |
| San Francisco | +4% | $260 | +34% |
| Philadelphia | +4% | $176 | +21% |
| Phoenix | -1% | $272 | +27% |
| Dallas | -2% | $189 | +14% |
| Las Vegas | -6% | $180 | +28% |
| New York City | -7% | $226 | +39% |
| Denver | -8% | $186 | +23% |
| Seattle | -8% | $175 | +7% |
| Kansas City | -13% | $187 | +16% |
| Los Angeles | -14% | $266 | +23% |
| Austin | -14% | $214 | +9% |
Data collected October 28, 2026, from public Airbnb, Vrbo and Booking.com data, compared with bookings as of October 28, 2025. City sample, not national data. Figures may change as more bookings come in.
Want to learn what PriceLabs can do for you? See for yourself with a free trial. Get started now!