Get started with PriceLabs now!
Want to learn what PriceLabs can do for you? See for yourself with a free trial. Get started now!

Your calendar looks soft for a weekend in September. The market data says demand is flat. Then a heritage festival you knew about in March fills every property in town at rates you did not capture. Vacation rental market demand analysis exists to stop exactly that. For a growing property manager, the hard part is rarely the software. It is combining what the data shows with what you know about your town, then explaining both to an owner who wants a reason for every rate change. This guide walks through the demand signals worth watching, how to map local events onto them, and how to turn the result into owner reports that hold up under questioning.
Vacation rental market demand analysis is the practice of reading booking pace, occupancy, and rate movement across a defined comp set to work out where demand is heading before it shows up in your own bookings. It combines platform data with local knowledge, such as event calendars and school terms, so pricing decisions run ahead of the market rather than reacting to it. Done well, it produces a defensible reason for every seasonal pricing change. Most managers already have the raw inputs sitting inside Portfolio Analytics and their market view.
The gap is usually interpretation. Two properties can show identical occupancy while one is pacing well ahead of last year and the other is quietly filling at the wrong price. RevPAR catches that difference where occupancy alone hides it.
This matters more for property managers than for solo hosts. You are answering to owners who see a single number and draw conclusions from it, which is why portfolio performance needs market context attached before it reaches them.
Start with a comp set that actually resembles your inventory. A comp set built on bedroom count, location radius, and amenities gives you a benchmark you can defend, and PriceLabs Market Dashboards lets you save that set so it flows into pricing and pacing views without rebuilding it each time.
From there, five signals do most of the work in demand forecasting. Each one answers a different question about where the market is heading, and together they form the backbone of vacation rental market demand analysis for a multi property portfolio. Reading them alongside your Portfolio Analytics view keeps the picture consistent across listings.
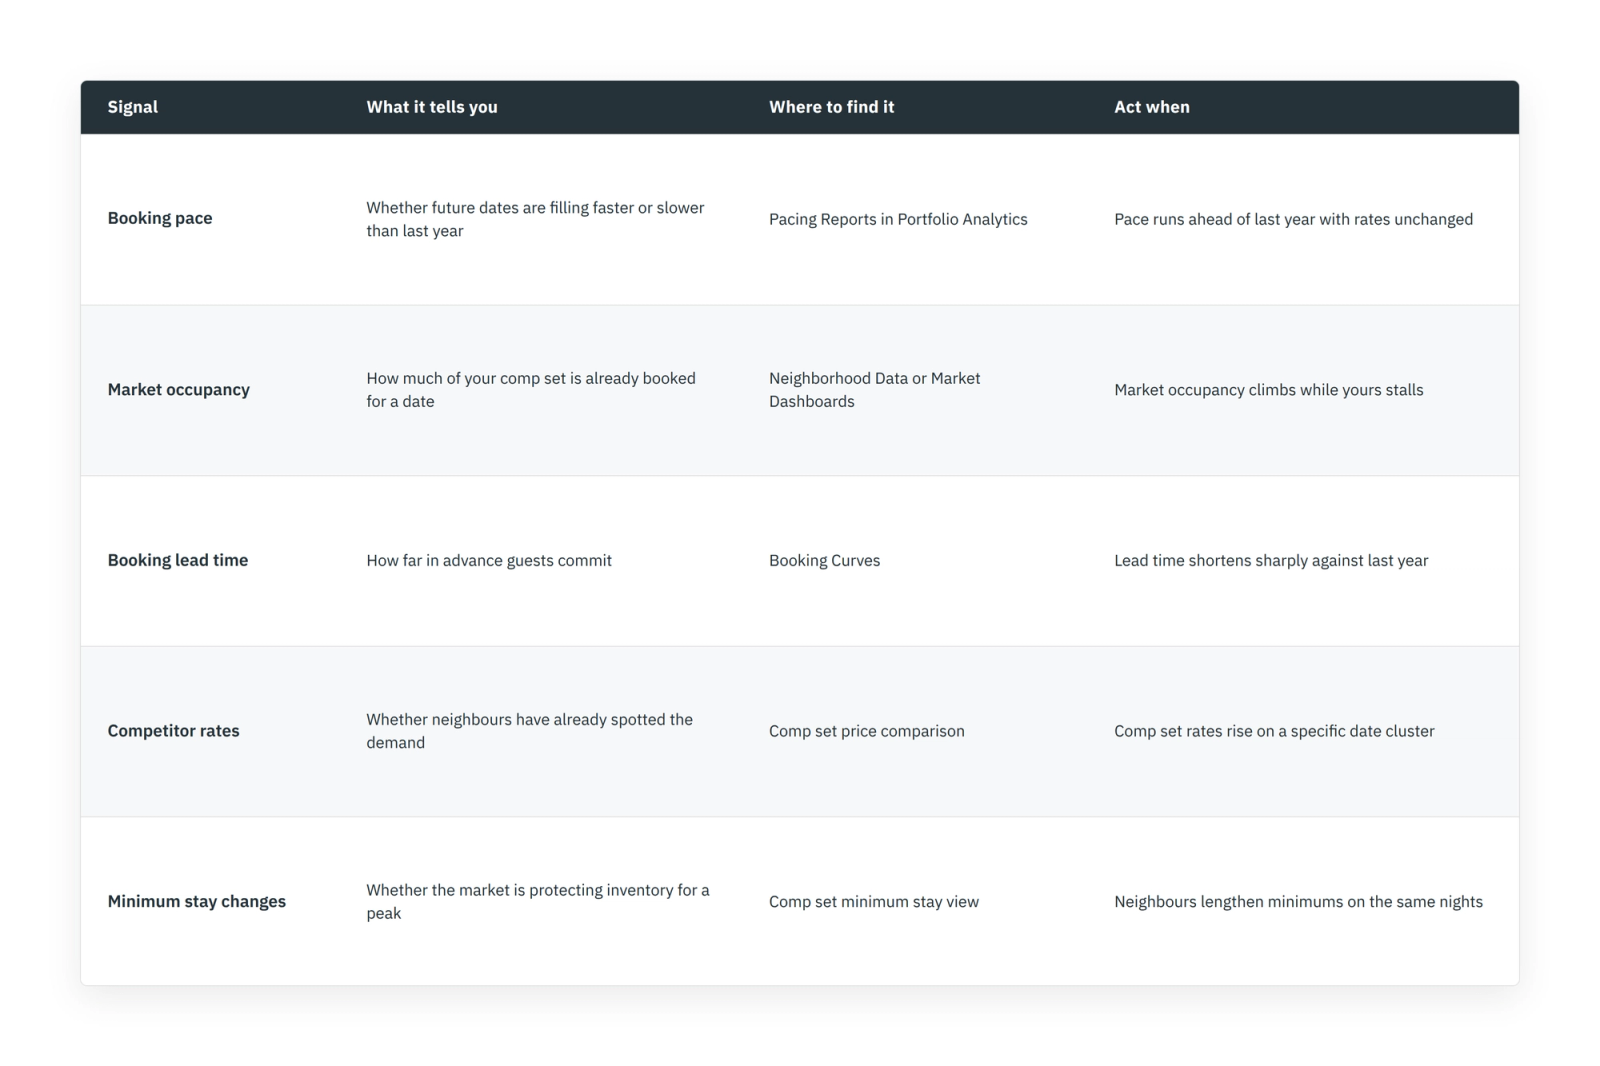
Booking pace deserves the most attention. Pacing Reports compare your current position against the same period last year and against the market, which separates a genuine demand shift from a normal seasonal curve.
Competitor movement is the signal managers miss most often. When neighbouring listings raise rates and tighten minimum stays on the same nights, they have found something, and competitor price tracking surfaces that pattern early.
Lead time is the quiet one in any vacation rental market demand analysis. Shortening lead times on specific dates often signal an event that has not been publicised widely yet, and occupancy against ADR will show whether you are trading rate for volume you did not need to trade.
Your own vacation rental market demand analysis does not start from zero, because PriceLabs already carries an events layer. The Events and Holidays table shows events, holidays, and high demand dates in your hyperlocal market alongside the average price set for each date, and you can report a missing event for review.
No event feed catches everything, though. Your own calendar of festivals, conferences, university terms, and public holidays fills the gaps, and PriceLabs itself explains how much its recommendations depend on market booking data rather than announcements.
Scale matters when you judge an event. European Heritage Days, run jointly by the Council of Europe and the European Commission, opens more than 30,000 sites across the 48 states party to the European Cultural Convention and draws roughly 20 million visitors each year. Dates vary by country and stretch from September into November, so a manager in France works to a different weekend than one in Italy. That variation is the point: local events reward local knowledge, and market by market differences are real.
Recurring large events give you a cleaner read because you have last year to compare against. PriceLabs has published demand analysis on the Paris Olympics, the Eras Tour, the Super Bowl, and the 2024 solar eclipse, and the pattern across all four is the same. Demand builds earlier and higher than a normal weekend, and managers who wait for their own booking pace to confirm it price too late.
One caution worth building into your process. PriceLabs removes one-off local event demand from the following year's recommendations, so a festival that will not repeat should not drag your baseline upward, and strategy adjustments should account for that.
Vacation rental market demand analysis only pays off when it changes a rate. Start with base price, since pricing offsets and seasonal profiles carry more weight across a full year than any single date override.
For confirmed event dates, use Date Specific Overrides. They let you set a rate or minimum stay for named dates without touching the rest of your seasonal pricing, and customization options cover the common cases.
Dynamic pricing handles the rest. PriceLabs Dynamic Pricing adjusts nightly rates against demand, seasonality, and local events, and smart customization keeps your manual work limited to the dates that genuinely need it.
Demand forecasting should extend past the event itself. Watch the shoulder dates around an event. Guests often extend by a night on either side, and far out and last minute rules control how aggressively you hold rate as those dates approach.
Slow periods need the same discipline in reverse. Demand forecasting that only fires during peaks leaves the quiet months untouched, and slow season tactics are where many portfolios lose the most revenue.
AI features shorten the review cycle. PriceLabs surfaces AI insights on portfolio movement, and AI powered features flag listings that need attention so a small team can cover a large portfolio.
Vacation rental market demand analysis earns its keep in the owner conversation. Owners rarely dispute a number. They dispute a number without a reason attached, which is why owner conversations go better when the market comparison arrives alongside the property result.
Lead with the comparison. Showing occupancy, ADR, and RevPAR against the comp set tells an owner whether a soft month was a market problem or a pricing problem, and management KPIs give you a consistent set to report on every cycle.
Then explain the decision. A short note saying you raised rates on a specific weekend because comp set occupancy was climbing and lead times were shortening does more for trust than a revenue chart alone, and manager workflows show how this fits into a monthly cadence.
Automate the delivery. Owner reports built from Market Dashboards come as branded PDF exports and scheduled summary emails, and the report builder lets you save a template so each owner receives the same view without manual assembly.
Keep the reporting rhythm steady. Monthly works for most portfolios, weekly during peak season, and revenue management habits matter more than the depth of any single report.
Vacation rental market demand analysis works when the data and your local knowledge check each other. The data tells you what the market is doing. Your event calendar tells you why, often weeks before the booking pace confirms it. Build the comp set, watch pace and competitor movement, map your events, price the confirmed dates deliberately, and report the reasoning to owners every cycle. Managers who run this loop consistently spend less time defending rates and more time setting them. If you are formalising the process across a portfolio, the vacation rental revenue management guide covers how pricing, pacing, and reporting connect, and new property launches follow the same principles from day one.
Maintain a calendar of local festivals, conferences, university terms, and public holidays, then compare those dates against booking pace and comp set occupancy in PriceLabs. Where a dated event lines up with rising market occupancy or shortening lead times, the demand is real and worth pricing for. Where the calendar shows an event but the market data stays flat, wait and monitor rather than raising rates. The Events and Holidays table covers many of these dates already.
Booking pace against last year is the strongest single indicator, followed by comp set occupancy, booking lead time, competitor rates, and minimum stay changes across your market. Pacing Reports in Portfolio Analytics compare your current position to both last year and the market. Watching occupancy and ADR together prevents you reading a full calendar as a success when rates were set too low.
Show the property result next to the market benchmark, then give the reason for each significant rate change in one or two sentences. Owners accept a rate rise when they can see comp set occupancy climbing on the same dates. Scheduled reports keep the cadence predictable, and data backed owner trust builds from consistency rather than from any single strong month.
Yes. Dynamic pricing handles the seasonal baseline while Date Specific Overrides hold your chosen rates and minimum stays on named event dates. This keeps manual work limited to the dates you actually have insight on. Customization settings let you apply the same rules across a group of listings rather than one at a time.
Adjust as soon as the event is confirmed and dated, then review as booking pace develops. Large recurring events draw bookings months ahead, so waiting for your own calendar to fill usually means pricing behind the market. Reviewing AI assisted revenue management outputs weekly during the run up keeps the adjustment honest.
Want to learn what PriceLabs can do for you? See for yourself with a free trial. Get started now!