Table of Contents
Updated : Feb 21, 2026
To ensure your forecast is reliable, you must move beyond static averages and into dynamic scenario modeling. This guide introduces a systematic PriceLabs workflow that simulates how specific property features interact with real-time market demand.
By curating hyper-local competitor sets and adjusting for specific demand surges, you replace broad guesses with high-precision revenue targets. Unlike standard estimators that rely on historical data, this method accounts for “Event Alpha”—the massive revenue spikes that determine true profitability.
This approach ensures your financial projections are built on the same live competitive data used to price individual nights, identifying which assets offer the highest yield with professional-grade accuracy.
Understanding Airbnb Income Potential and Market Variability
Airbnb income potential refers to the maximum achievable revenue from a property, calculated based on Average Daily Rate (ADR), occupancy rate, seasonality, and local demand trends. Understanding the variability across different markets and property types is crucial for accurate financial planning, as revenue is rarely static.
Event-driven surges can cause massive shifts; PriceLabs data has shown that during major events like FIFA, ADR can jump by as much as 340%.
Several key factors drive market variability:
- Location: Revenue potential differs vastly between high-density urban centers and seasonal leisure destinations.
- Events and Local Demand: Festivals, conferences, and holidays create predictable spikes in both ADR and occupancy.
- Property Characteristics: The size of the property, its specific amenities, and the overall quality of the listing dictate its competitive ceiling.
Defining Comparable Listings for Accurate Benchmarking
To generate a reliable revenue forecast, you must first identify the right “comps”, comparable listings. Comparable listings (or “comps”) are properties similar in location, size, amenities, and overall guest appeal.
For the most accurate results, we recommend using PriceLabs Market Dashboards filters to curate a set of 8–12 highly relevant listings. These should match your target property on several key dimensions:

- Location: Filter by a specific neighborhood or a tight radius to ensure the market dynamics are identical.
- Property Type: Ensure you are comparing “like-for-like,” such as apartments to apartments or houses to houses.
- Capacity and Amenities: Match for guest capacity (number of bedrooms/bathrooms) and “must-have” amenities like pools, hot tubs, or dedicated workspaces.
- Booking Policies: Consider listings with similar cancellation policies and house rules to ensure a fair comparison.
Dynamically Price Your Property and Get FREE Custom Reports Tailored To Your Property!
Use PriceLabs Dynamic Pricing to competitively and dynamically price your property according to demand shifts and analyze past performance to set a strong pricing strategy for your property.
Create your Account NowEstablishing Baseline Market Metrics with PriceLabs Market Dashboards
Once you have identified your set of comparable listings, use PriceLabs Market Dashboards to set realistic revenue benchmarks, compare local competitors, analyze demand patterns, and review historical performance to make data-driven pricing decisions.

To establish a solid baseline, follow these steps:
- Analyze Historical Data: Pull 12–24 months of ADR and occupancy data for your selected comps. This long-term view is essential for spotting recurring seasonality and isolating event-driven outliers.
- Identify Market Trends: Look for consistent spikes, dips, and plateaus in the data to understand the “pulse” of the neighborhood.
- Benchmarking Metrics: Use the dashboard to compare specific performance indicators, such as:
- ADR on event vs. non-event months: Determine the exact premium the market commands during peak times.
- Typical vs. peak occupancy rates: Understand the realistic ceiling for your booking frequency.
Setting Base Price and Minimum Stay Rules to Maximize Revenue
Establishing the right foundation for your pricing strategy is critical for capturing maximum income without sacrificing occupancy or leaving “orphan nights“—short unbooked periods that are difficult to fill.
A fundamental component of this foundation is the Base Price, which is the average nightly rate set as a starting point for dynamic pricing adjustments. To help determine a competitive starting rate, you can use the PriceLabs Base Price Help tool for data-driven suggestions.

Equally important are your Minimum Stay rules. Utilizing a Minimum Stay Recommendation Engine allows you to avoid low-value, short-term bookings that may block your calendar from more profitable, longer stays.

To optimize your setup, follow these practical steps:
- Configure the Base Price: Set a listing-level base price that reflects recent ADR trends.
- Apply Minimum Stay Rules: Implement rules that include special handling for gaps in your calendar and specific value thresholds to ensure every booking is profitable.
- Manage Orphan Nights: Consider applying gradual discounts for shorter unbooked periods to maintain high occupancy throughout the month.
Dynamically Price Your Property and Get FREE Custom Reports Tailored To Your Property!
Use PriceLabs Dynamic Pricing to competitively and dynamically price your property according to demand shifts and analyze past performance to set a strong pricing strategy for your property.
Create your Account NowIntegrating Event Detection and Hyper-Local Demand Signals
Demand-driven pricing allows your rates to fluctuate automatically based on real-time spikes in booking activity. For example, if a major concert is announced nearby, demand for your specific radius will surge, and your prices should reflect that premium immediately.
Key strategies for capturing these signals include:
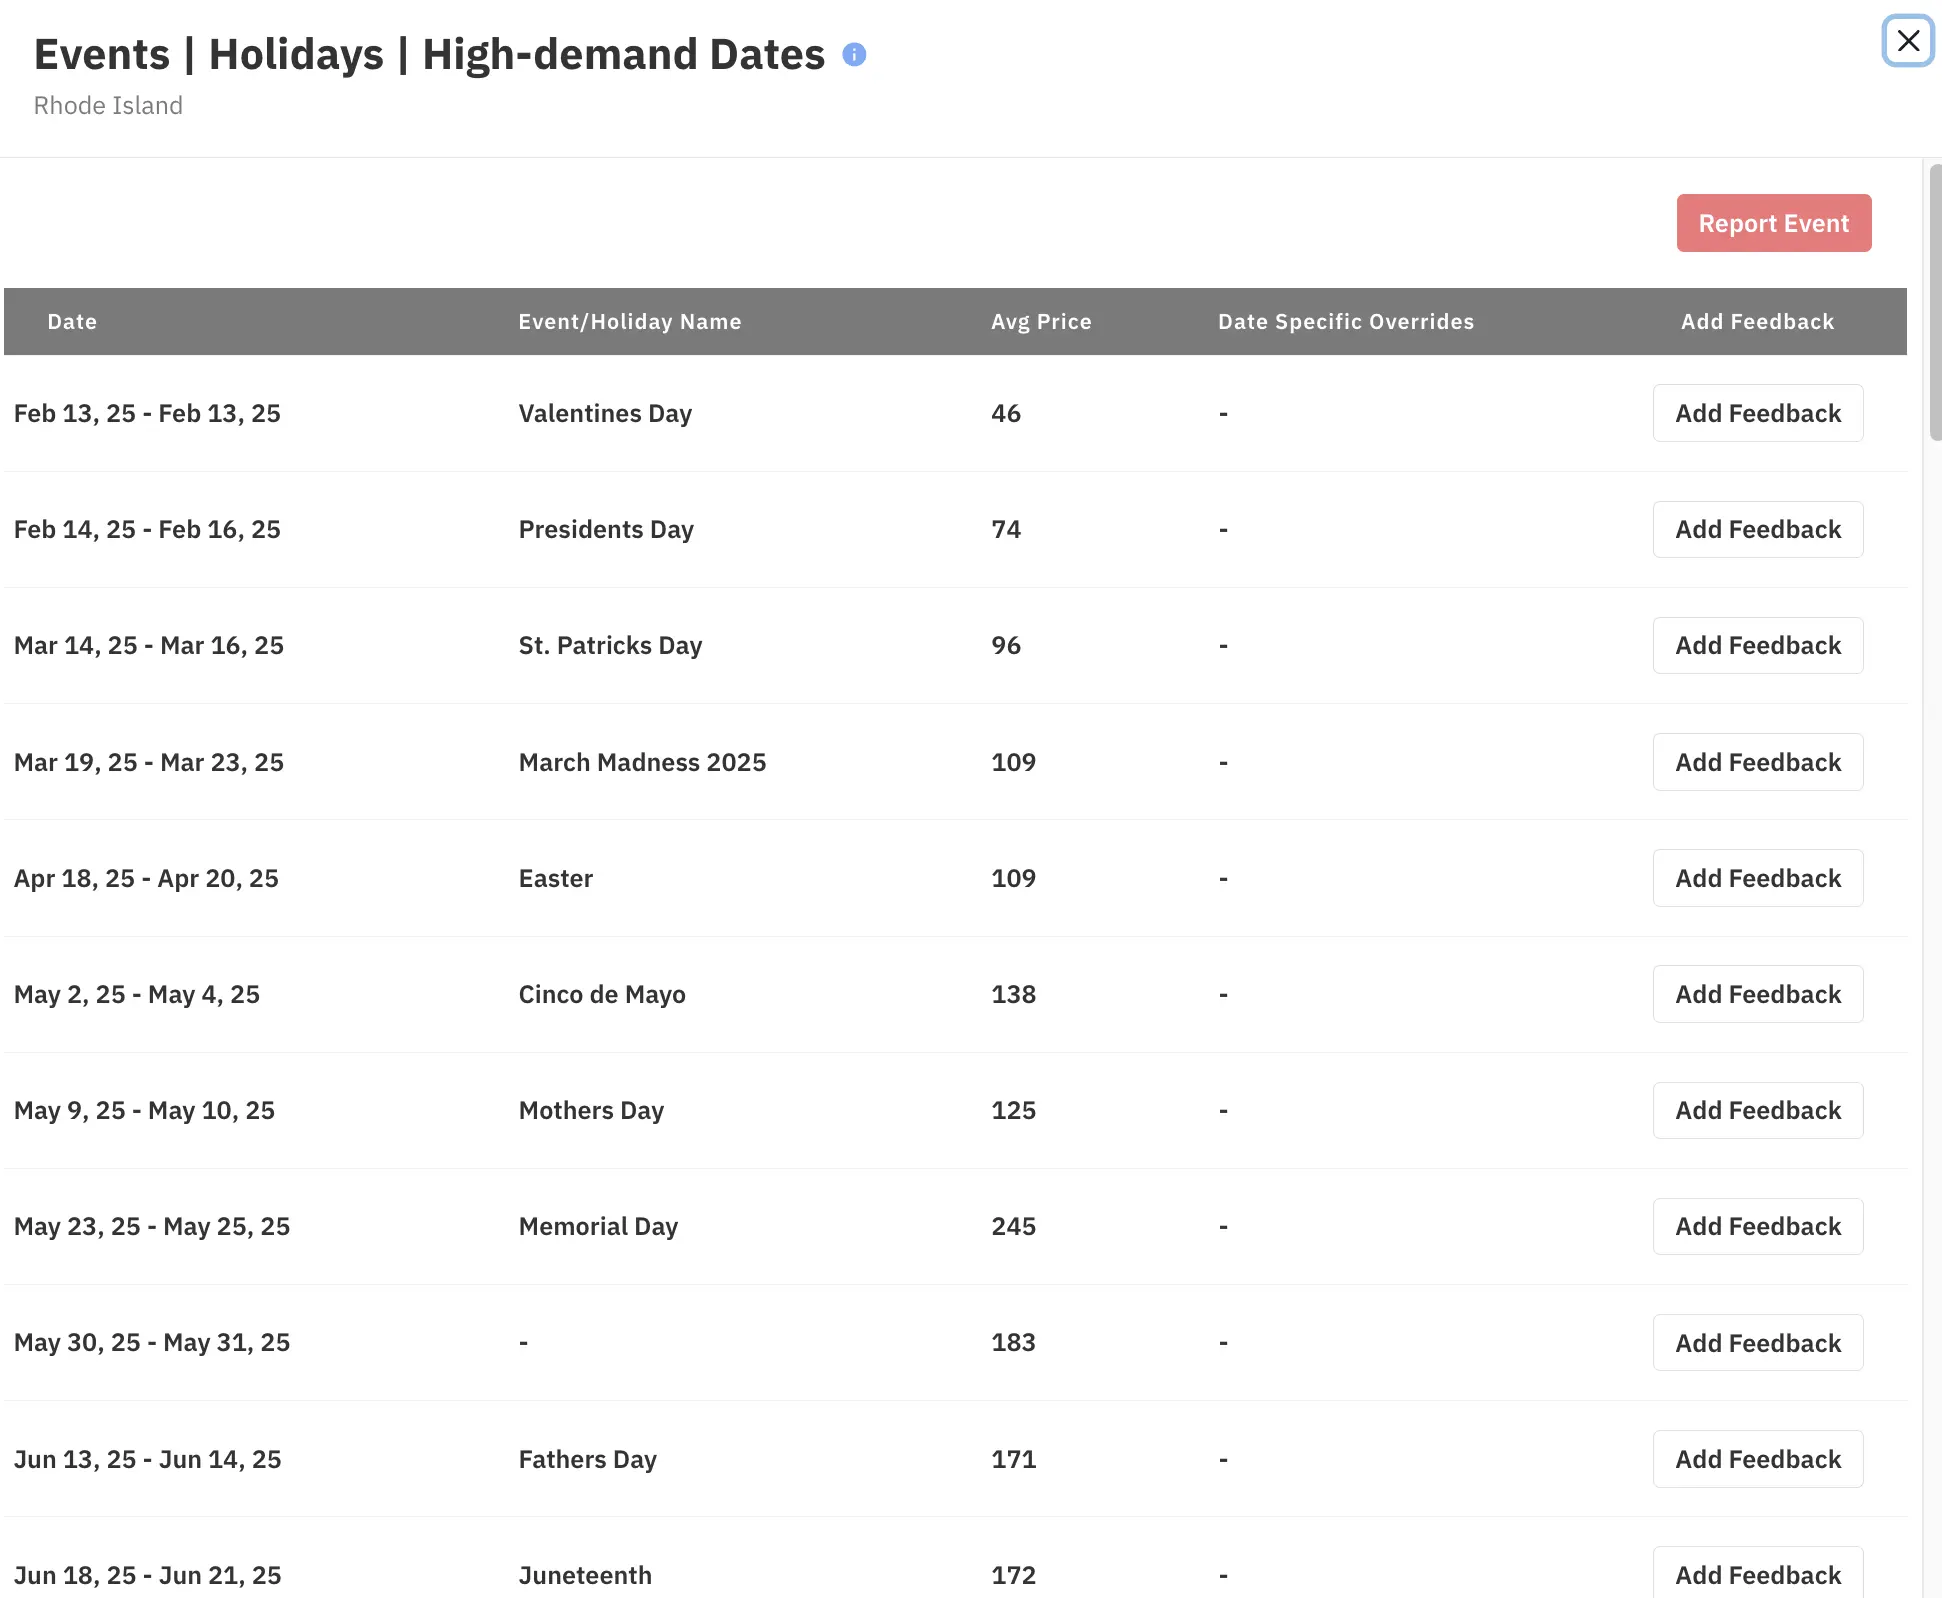
- Automatic Event Detection: PriceLabs identifies major events and local holidays, automatically adjusting your rates upward during high-demand windows.
- Hyper-Local Customization: Use the dashboard to see how many people are searching for your specific neighborhood compared to the city at large.
- Manual Overrides for Local Knowledge: While the algorithms are powerful, your own local knowledge—such as a specific school graduation or a niche local festival—can be used to manually adjust prices or minimum stays for those dates.
Validating and Refining Your Income Potential Comparison Strategy
The key to long-term accuracy lies in consistent monitoring and data-driven adjustments:
- Review Market Performance Regularly: Markets are dynamic. Check your PriceLabs Market Dashboards at least once a month to see if your chosen “comps” are still the most relevant or if new, high-performing listings have entered the area.
- Analyze the Booking Pace: Are you booking up too quickly? You might be priced too low. Are you seeing zero activity while your competitors are filling up? Your base price or minimum stay rules likely need downward calibration.
- Compare Actuals vs. Projections: Use the Portfolio Analytics tool to compare your actual earned revenue against your initial estimates. This “reality check” helps you refine your forecasting model for the next season.
- Audit Your Amenities: If your income potential is lagging behind top-tier comps, identify the “amenity gap.” Sometimes, adding a small feature like a coffee station or high-speed Wi-Fi can justify moving your property into a higher ADR bracket.
Dynamically Price Your Property and Get FREE Custom Reports Tailored To Your Property!
Use PriceLabs Dynamic Pricing to competitively and dynamically price your property according to demand shifts and analyze past performance to set a strong pricing strategy for your property.
Create your Account NowBest Practices and Common Pitfalls in Comparing Airbnb Income Potential
Common Pitfalls to Avoid
- Relying on “Market Averages”: Broad city-level averages are often misleading. A luxury condo in the city center and a suburban basement suite may both be “2-bedroom apartments,” but their income potential is not comparable.
- The “Set and Forget” Fallacy: Markets are fluid. Using a static price based on a single point-in-time comparison can lead to underpricing during peak events or sitting empty during the off-season.
- Ignoring the “Orphan Night” Drain: High minimum stays can protect your ADR but destroy your occupancy by leaving 1- or 2-night gaps that are impossible to fill.
- Underestimating Expenses: Professional hosts often fail to account for the “true cost” of higher occupancy, such as increased utility wear, faster amenity depletion, and higher maintenance frequencies.
Best Practices for Elite Performance
To ensure your income potential comparisons remain accurate and actionable, adopt these industry-standard best practices:
- The 8-12 Rule: Never base your strategy on just one or two “star” properties. Curate a “Comp Set” of 8 to 12 listings to smooth out outliers and get a true sense of the market ceiling.
- Forward-Looking Analysis: Historical data tells you what happened; Booking Pace (how quickly competitors are filling up for future dates) tells you what is happening. Use PriceLabs Market Dashboards to see future demand trends.
- The Amenity Audit: Periodically review the top 10% of earners in your area. If they all offer “Dedicated Workspaces” or “EV Chargers” and you don’t, your income potential is capped regardless of your pricing.
- Conservative Forecasting: When projecting for investors or personal budgeting, always run a “Base Case” and a “Best Case” scenario. Use the 50th percentile of your comp set for the base and the 75th or 90th percentile for the best case.
Frequently Asked Questions (FAQs)
How often should I update my income potential comparison?
Markets fluctuate based on new supply and changing travel patterns. You should perform a deep-dive review quarterly and a quick pulse check monthly using your Market Dashboards to ensure your “comp set” remains relevant.
Why does my estimated income differ from generic online calculators?
Generic calculators often use “scraped” data that includes blocked calendar days as booked days, inflating occupancy. The PriceLabs method uses de-duped, verified booking data, providing a more conservative but realistic financial target.
Can I use this method for a property I haven’t bought yet?
Yes. Professional investors use this workflow during due diligence. By creating a Market Dashboard for a specific zip code or neighborhood, you can model the potential ROI before making an offer.
How many “comps” are enough for a valid comparison?
While you might find 50 properties in your area, more isn’t always better. Aim for 8–12 highly similar properties. Too many outliers (e.g., comparing a luxury villa to a budget suite) will skew your ADR and lead to inaccurate projections.