
Table of Contents
Updated : Mar 26, 2026
Here is the uncomfortable truth about most short-term rental business plans: the numbers look great until you actually start operating and calculate Airbnb income. New hosts consistently fall into the same trap — they look at a nearby Airbnb listing, see $250/night, multiply it by 30 days, and suddenly they’re projecting $90,000 a year in gross revenue. What they end up with is far more sobering.
The biggest mistake new hosts make is overestimating revenue and underestimating expenses. It’s not a character flaw — it’s a data problem. Without access to real market occupancy rates, competitive ADR benchmarks, and a clear picture of operating costs, even the most disciplined investor is essentially guessing.
This guide fixes that. We’ll walk through the exact formulas professional STR investors use to evaluate a property’s profitability — from gross revenue down to cash-on-cash return — and show you how the PriceLabs Revenue Estimator Pro automates the most uncertain part of that equation so your projections are grounded in actual market data, not wishful thinking.

The Core Equation: Gross Revenue vs. Net Income
Every conversation about Airbnb income needs to start with a clear distinction that too many beginner hosts skip over: gross revenue and net income are not the same thing, and conflating them is where most financial projections go off the rails.
Gross Revenue is the total amount guests pay to stay at your property. It’s the top-line number — the one that sounds exciting in a pitch deck. Net Income is what actually lands in your bank account after you’ve paid for everything it costs to generate that revenue. In a well-run short-term rental, the gap between those two numbers can be 40–60%.
To get from a blank spreadsheet to a reliable income projection, you need to understand three foundational metrics — the “Big Three” of STR performance that every formula in this guide builds on:
ADR (Average Daily Rate): Your average revenue per booked night. Calculated as total room revenue ÷ number of nights booked.
Occupancy Rate: The percentage of available nights that are actually booked. Target benchmarks vary significantly by market.
RevPAR (Revenue Per Available Room): ADR multiplied by Occupancy Rate. The single most powerful metric for comparing STR performance across markets, because it collapses both pricing and demand into one comparable number.
Understanding how RevPAR functions in vacation rentals is especially important when evaluating multiple markets. A property with a high ADR but low occupancy can easily underperform a market with a moderate ADR and consistently strong demand.
The Core Revenue Formula:
Example: $180 ADR × 68% Occupancy = $122.40 RevPAR → $44,676 projected annual gross revenue
RevPAR = ADR × Occupancy Rate Annual Gross Revenue = RevPAR × 365
Step 1: Estimating Your Gross Rental Revenue
Let’s address the elephant in the room: you cannot look at your neighbor’s Airbnb listing, see that they charge $220 a night, and assume you’ll earn that rate every night of the year. That number tells you almost nothing useful on its own.
What you actually need to know is what the market will bear — and the market is a moving target. Airbnb revenue is driven by three intersecting forces that change constantly:
1. Seasonality: A beach property in the Outer Banks might achieve 90%+ occupancy in July and less than 20% in January. A ski chalet in Park City works in inverse. Your annual revenue projection must account for these swings, not just assume a flat average occupancy rate year-round.
2. Competitive Set: Your ADR is shaped by what comparable properties in your area are charging. A 2-bedroom condo doesn’t compete with a 5-bedroom lakefront estate, even if they’re on the same street. Understanding your comp set — properties similar in size, amenities, and location — is the foundation of realistic revenue modeling. This is where researching the right STR markets pays enormous dividends before you ever make an offer on a property.
3. Historical Demand Data: Projected occupancy rates should be based on actual booking patterns from the market, not national averages or optimistic assumptions. A market can look attractive on paper but have structural oversupply issues that depress occupancy across all listings.
The Most Common Projection Error When Calculating Airbnb Income
Using a single “average” nightly rate and multiplying by 365 — or even 365 × 70% — without accounting for seasonal demand curves. This almost always produces an overstated revenue figure and sets up operators for disappointment in slow months.
Where PriceLabs Revenue Estimator Pro Comes In
This is precisely the problem that the PriceLabs Revenue Estimator Pro was built to solve. Instead of manually scraping competitor listings, estimating seasonal demand, and hoping your ADR assumption is close to accurate, the tool pulls real-time market data for any address and delivers a demand-driven revenue projection calibrated to actual booking patterns in that specific submarket.
You input the property address and bedroom count. The tool outputs a projected annual revenue range, estimated ADR, and expected occupancy rate — all grounded in live market data rather than industry-average assumptions. For anyone evaluating a potential acquisition or validating a new listing strategy, this eliminates the most consequential source of error in the projection process.
Step 2: Deducting Your Airbnb Operating Expenses (The Hidden Costs)
If overestimated revenue is the first mistake new hosts make, underestimated expenses is the second — and it hits just as hard. The true cost of running an Airbnb extends well beyond what most first-time investors or new property launches budget for.
Expenses fall into two categories: costs that are fixed regardless of how many guests you host, and costs that scale with occupancy and activity.
| Category | Expense Item | Estimated Cost / Rate | Frequency |
| Fixed | Mortgage / Debt Service | Varies by loan | Monthly |
| Fixed | Property Taxes | 0.5% – 2.5% of property value | Annually |
| Fixed | HOA Fees | $0 – $800+ | Monthly |
| Fixed | STR-Specific Insurance | $1,500 – $4,000 | Annually |
| Fixed | Software (PMS/Tools) | $70 – $300 | Monthly |
| Fixed | Base Utilities & Internet | $150 – $400 | Monthly |
| Variable | Airbnb Commission | ~3% of booking value | Per Booking |
| Variable | Booking.com Commission | ~15% of booking value | Per Booking |
| Variable | Professional Cleaning | $75 – $300 | Per Turnover |
| Variable | Consumables & Supplies | $15 – $40 | Per Stay |
| Variable | Maintenance & Repairs | 1% – 2% of property value | Annually |
| Variable | Property Management Fee | 15% – 30% of gross revenue | Monthly |
A few of these deserve closer attention because they’re consistently underestimated:
STR-Specific Insurance: A standard homeowner’s policy almost certainly won’t cover you while guests are in your property. Specialized short-term rental insurance fills this gap, but it comes at a cost most first-time investors don’t budget for until they’re already operating.
OTA Commission Differentials: Airbnb’s host fee structure (approximately 3% for most hosts) looks very different from Booking.com’s model (typically 15%). If you’re distributing across multiple channels — which most experienced operators do — your blended commission rate will land somewhere in between, and that number materially affects your net revenue calculation.
Cleaning at Scale: At low occupancy, cleaning costs feel manageable. At 70–80% occupancy with an average stay of 3–4 nights, you could be turning the property over 60–80 times a year. At $150 per turnover, that’s $9,000–$12,000 annually that’s easy to miss in a back-of-napkin projection.
Pro Tip: Build a Full Operating Expense Stack
Before you underwrite any STR acquisition, build a line-by-line expense model. Most experienced investors target total operating expenses (excluding mortgage) at 35–50% of gross revenue as a reasonable baseline, depending on whether the property is owner-operated or professionally managed.
Step 3: Calculating Your True ROI
Once you have a reliable gross revenue estimate and a realistic operating expense stack, you can calculate Airbnb income using the metrics that real estate investors actually use to make buy/hold/sell decisions. These three formulas are the bedrock of any serious STR underwriting analysis.
Formula 1: Net Operating Income (NOI)
NOI is the most fundamental metric in real estate investing. It tells you how much income the property generates from operations, before debt service.
NOI = Gross Revenue − Operating Expenses
Example: $52,000 Gross Revenue − $24,000 Operating Expenses = $28,000 NOI Note: Your mortgage/debt service is NOT included in operating expenses for this calculation.
NOI is used in both the Cap Rate and DSCR (Debt Service Coverage Ratio) calculations, so getting it right is critical. The instinct to include your mortgage payment in operating expenses is one of the most common errors in amateur underwriting — resist it.
Formula 2: Cap Rate (Capitalization Rate)
Cap Rate is how investors compare the income-generating potential of different properties, regardless of how they’re financed. It’s the purest measure of a property’s investment performance as a standalone asset.
Capitalization Rate
Cap Rate = (NOI ÷ Property Value) × 100
Example: $28,000 NOI ÷ $420,000 Property Value = 6.67% Cap Rate
For STR properties, a cap rate of 6–10% is generally considered solid depending on the market.
Understanding how to value an Airbnb property using cap rate requires market context. A 6% cap rate in a high-demand coastal market might represent an excellent acquisition; the same cap rate in a tertiary market with declining tourism trends is a very different proposition. Cap rate is a starting point for comparison, not a verdict.
Formula 3: Cash-on-Cash Return
For leveraged investors — anyone using a mortgage — cash-on-cash return is the most practically relevant metric. It tells you how much pre-tax cash flow you’re generating relative to the actual cash you invested out of pocket.
Cash-on-Cash Return
CoC Return = (Annual Pre-Tax Cash Flow ÷ Total Cash Invested) × 100
Example: $8,400 Pre-Tax Cash Flow ÷ $105,000 Cash Invested (down payment + closing costs + furnishing) = 8.0% CoC Return
Pre-tax cash flow = NOI minus your annual mortgage payments. Total cash invested includes your down payment, closing costs, and any upfront furnishing/renovation costs — all the cash you actually had to write checks for before the property generated its first dollar of revenue.
For investors using strategies like the BRRRR method for STR properties, cash-on-cash return is particularly powerful because the goal is to recycle the initial capital investment through refinancing, which can dramatically change this metric over time.
The Investor’s Checklist
A well-underwritten STR acquisition should have a positive NOI, a cap rate that’s competitive with the local market, and a cash-on-cash return above your cost of capital. If any one of these three is weak, the others rarely compensate enough to make the deal compelling.
Step 4: How Dynamic Pricing Changes Your Revenue Projections
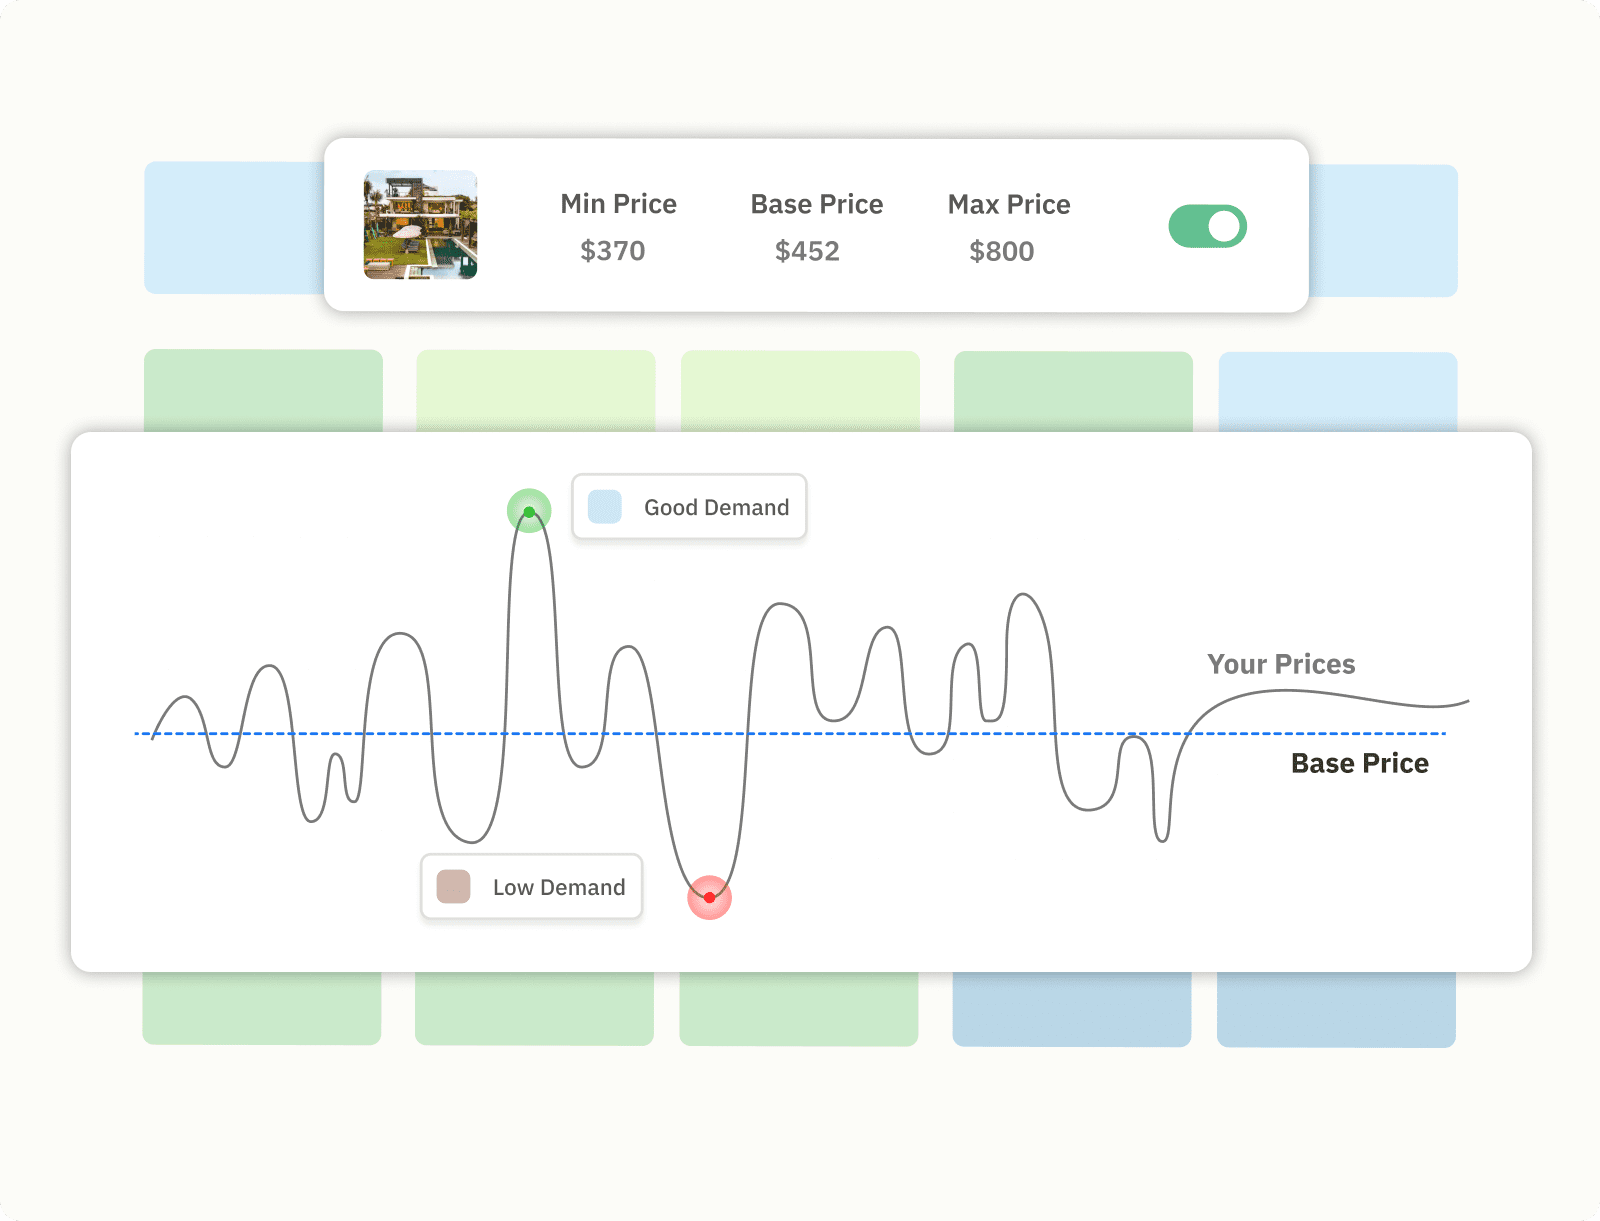
Here’s something that most static income projections miss entirely: a fixed nightly rate is an inherently flawed model for short-term rental revenue. The market doesn’t price stays at a constant rate — demand fluctuates dramatically by day of week, season, local events, booking lead time, and competitive inventory levels. If your pricing doesn’t respond to those signals, you’re leaving real money on the table.
Consider what happens with static pricing. During a local festival weekend when competitors are fully booked, your fixed $180/night property might have commanded $320 had you adjusted for demand. Conversely, during a slow mid-week stretch in the shoulder season, that same $180 rate might be driving prospective guests to lower-priced competitors — leaving your property vacant when it could have been generating some revenue at $130.
The data is consistent across markets: operators who implement dynamic pricing strategies see baseline revenue increases of 10–20% compared to static-price counterparts in the same market, primarily through two mechanisms: capturing premium demand during peak periods and filling inventory gaps during softer periods.
This matters enormously for how you build income projections. A static projection using a fixed ADR will systematically understate revenue potential if you plan to use dynamic pricing — which you should. And it will just as systematically overstate it if you assume peak-season rates apply year-round.
The right approach is to build projections that assume dynamic pricing from day one, and to understand how dynamic pricing strategies directly lift revenue projections when modeled correctly. The PriceLabs Revenue Estimator Pro incorporates demand-curve modeling so the projections it generates already reflect the kind of revenue performance achievable with intelligent pricing — not an optimistic flat-rate assumption.
The Compounding Effect
Dynamic pricing doesn’t just increase revenue during peak periods. By lowering rates strategically during slow periods to maintain occupancy, it also increases the number of reviews you accumulate — which lifts your search ranking on Airbnb, which increases demand, which gives you more pricing power. The effect compounds over time.
| Pricing Approach | Est. Annual Occupancy | Est. Annual Revenue | Revenue Uplift |
|---|---|---|---|
| Static Rate ($180/night) | 62% | $40,770 | Baseline |
| Dynamic Pricing (PriceLabs) | 71% | $49,100 | +20.4% |
Illustrative example based on a 2-bedroom property in a mid-tier STR market. Actual results vary by market, property type, and host responsiveness.
Stop Guessing: How to Use an Airbnb Profitability Calculator
You now have the formulas. The challenge is that the most consequential input — projected ADR and occupancy — is the hardest to estimate accurately without access to real market data. This is where an Airbnb income calculator built on live data transforms the analysis from educated guesswork into evidence-based underwriting.
The PriceLabs Revenue Estimator Pro was designed specifically for this use case. Here’s how it works in practice:
PriceLabs Revenue Estimator Pro — Walkthrough
Step 1: Enter the Property Address
Input the full street address of the property you’re evaluating. The tool uses geolocation to identify the specific submarket and pull relevant comparable data — so it matters whether you’re on the beach side or the bay side of a destination, not just what city you’re in.
Step 2: Specify Bedroom Count
Bedroom count is the primary variable that defines your comp set. The tool filters market data to comparable properties so your ADR and occupancy benchmarks reflect what similarly-sized listings actually achieve — not the blended average of studios and 6-bedroom estates combined.
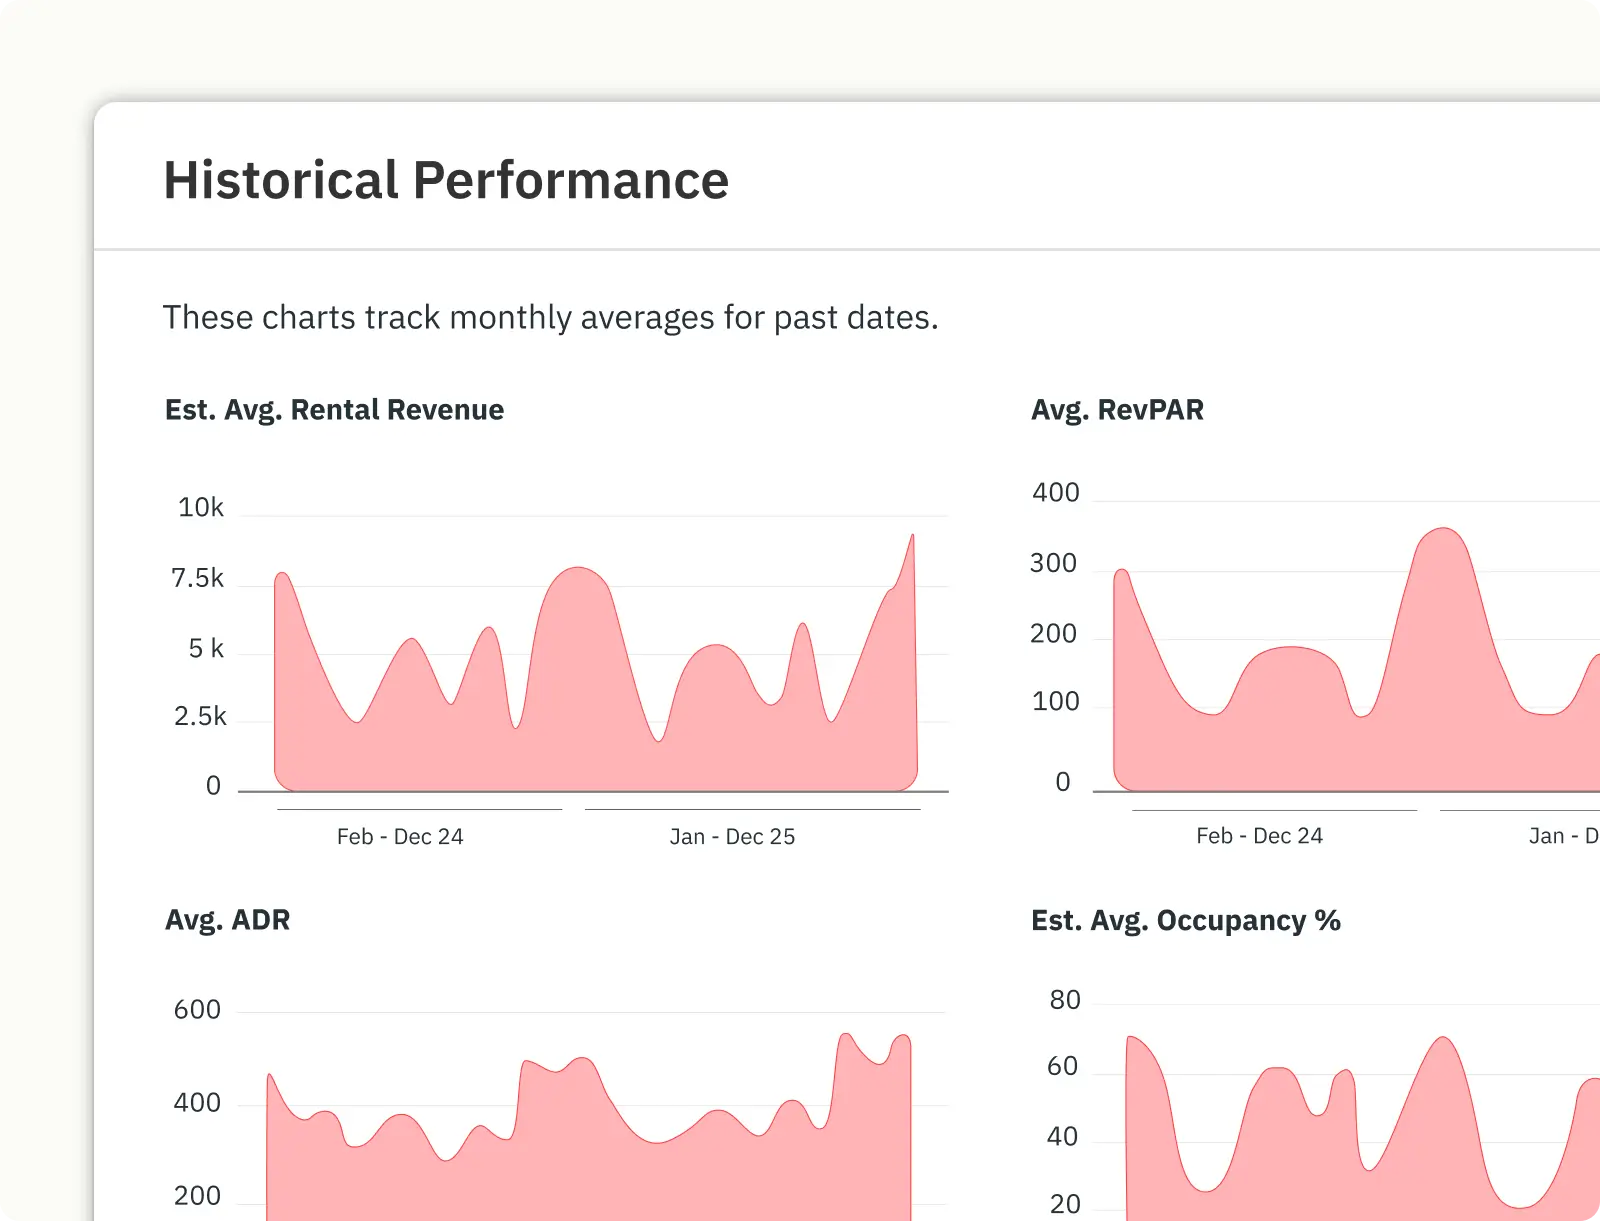
Step 3: Review Your Revenue Projection
The tool returns a projected annual revenue range, an estimated ADR based on current market conditions, and an expected occupancy rate derived from historical booking data for your submarket. These three numbers are the inputs your NOI, Cap Rate, and CoC calculations have been waiting for.
Step 4: Layer In Your Expense Stack
Take the projected gross revenue from the estimator and run it through the formulas in Step 2 and Step 3 of this guide. You now have a complete, data-grounded profitability analysis — from gross revenue to cash-on-cash return — built on real market benchmarks rather than assumptions.
For investors evaluating multiple markets or multiple properties simultaneously, the speed advantage is significant. What would otherwise require hours of manual comp research and seasonal data analysis for each property can be condensed to minutes. For anyone actively searching for the right Airbnb property to acquire, having reliable revenue projections at the address level changes what’s possible in due diligence.
How To Get the Most Out of the Estimator
Run multiple scenarios: test the projected revenue for a 2-bedroom versus a 3-bedroom at the same address, or compare two properties in adjacent submarkets. The Estimator is most powerful as a comparative tool, not just a single-property calculator. Use the Revenue Potential Report Builder to dive deeper into market-level analysis once you’ve narrowed your options.
Conclusion: The Numbers Don’t Lie — But Only If You Run Them Right
Running the numbers is the single most important step before you launch a new vacation rental, scale an existing portfolio, or make any offer on a short-term rental investment property. Enthusiasm is not an underwriting methodology.
The framework in this guide gives you a complete picture of STR profitability analysis:
- Gross Revenue built on real ADR and occupancy benchmarks — not wishful assumptions
- Operating Expenses modeled at the line-item level, including the hidden costs most beginners miss
- NOI, Cap Rate, and Cash-on-Cash Return calculated with the same formulas professional real estate investors use
- Dynamic pricing factored into the revenue model from the start, not bolted on as an afterthought
The PriceLabs Revenue Estimator Pro handles the hardest part of this framework — delivering the market-calibrated ADR and occupancy data that makes every downstream calculation accurate. Everything else flows from there.
Whether you’re evaluating your first short-term rental acquisition or benchmarking a property you’re already operating, start with the data. The calculator is the first step.