
Table of Contents
Updated : Apr 2, 2026
Scotland’s vacation rental market remains a vital organ of the UK tourism economy. However, as we move through 2026, the “business as usual” approach is being tested by a fiscal and regulatory landscape unlike any we have seen before.
With the 2026 Non-Domestic Rates (NDR) revaluation hitting home, the vacation rental sector has emerged as the hardest-hit industry in the country. Some property managers are facing staggering rate increases of up to 400%, turning the challenge from simply “getting more bookings” into a high-stakes defense of the bottom line.
Compounding these cost spikes is the introduction of the first Visitor Levies, most notably in Edinburgh, where a 5% daily charge is now being woven into the guest experience. In this landscape, every night unbooked or underpriced isn’t just a missed opportunity—it’s a direct hit to your property’s viability.
To navigate this, we’ve brought together the advocacy-led perspective of the Association of Scotland’s Self-Caterers (ASSC) and the latest PriceLabs data from the World STR Index.
Bonus: Short-Term Rental Analytics & Market Data: The Complete Beginner’s Guide
1. A View from the Front Line: The Fiscal “Wake-Up Call.”
A Perspective from Fiona Campbell MBE, CEO of the ASSC
As we enter 2026, the “perfect storm” for Scottish operators has arrived. The latest ASSC Autumn Barometer reveals a sharp fall in business confidence, with 43% of operators pessimistic about the next 24 months. This isn’t just sentiment; it’s a reaction to a dramatic squeeze on profitability.
“Self-catering businesses are being hit from multiple directions at once – from the 2026 non-domestic rates revaluation and rising licensing costs to continued uncertainty in planning and visitor levies. Many operators are doing everything asked of them, yet finding the ground shifting beneath their feet.
When margins are this tight, and bookings are increasingly coming later and with less certainty, there is simply no room for error. While we continue to press for urgent, evidence-led policy reform, the reality is that operators are having to be more rigorous than ever in how they manage income and costs simply to remain viable.” –Fiona Campbell
The message from ASSC is that, in the face of mounting cost and regulatory pressures, operators are under growing pressure to take a more active and informed approach to managing their businesses simply to remain viable.
2. Market Performance: 2026 Key Indicators
The Scottish market continues to show resilience despite a high-cost environment and complex regulatory shifts. While supply has grown by 2% (reaching an average of 29,571 active listings), the market is navigating a post-peak recalibration in which guests are booking later, and professional property managers are prioritizing rate integrity over volume.
| Metric | 2024 (Full Year) | 2025 (Full Year) | Trend |
| Total Booked Nights | 4,568,675 | 4,365,218 | -4% |
| Average Occupancy | 60% | 59% | -1% |
| Active Listing Count | 28,869 | 29,571 | +2% |
Tap into Seasonal Peaks and Lows in Scotland
Whether you're navigating the low season or managing a high-turnover portfolio, PriceLabs gives you the analytical tools to stay competitive in the Scottish vacation rental narket without sacrificing your ADR.
Start Your free trialThe Professional Insight: Quality Over Quantity
The data reveals a “flight to quality.” While total booked nights have dipped by 4%, the 1% dip in occupancy suggests that the increase in supply is largely absorbing the shift in demand. For property managers, this means the focus is shifting away from a race to the bottom on pricing and toward protecting margins.
Pacing & The “Booking Cliff”
The most significant trend for 2026 is the compression of the booking window. While historical data shows a high-water mark in August, forward-looking indicators show that guests are waiting longer than ever to commit.
Future Occupancy Pacing (As of Jan 2026):
- January 2026: Currently pacing at 23%, significantly lower than the final 2025 realized occupancy of 43%.
- The Summer Horizon: August 2026 is currently pacing at only 10% occupancy—not because demand has vanished, but because the “wait-and-see” guest is now the dominant force in the market.
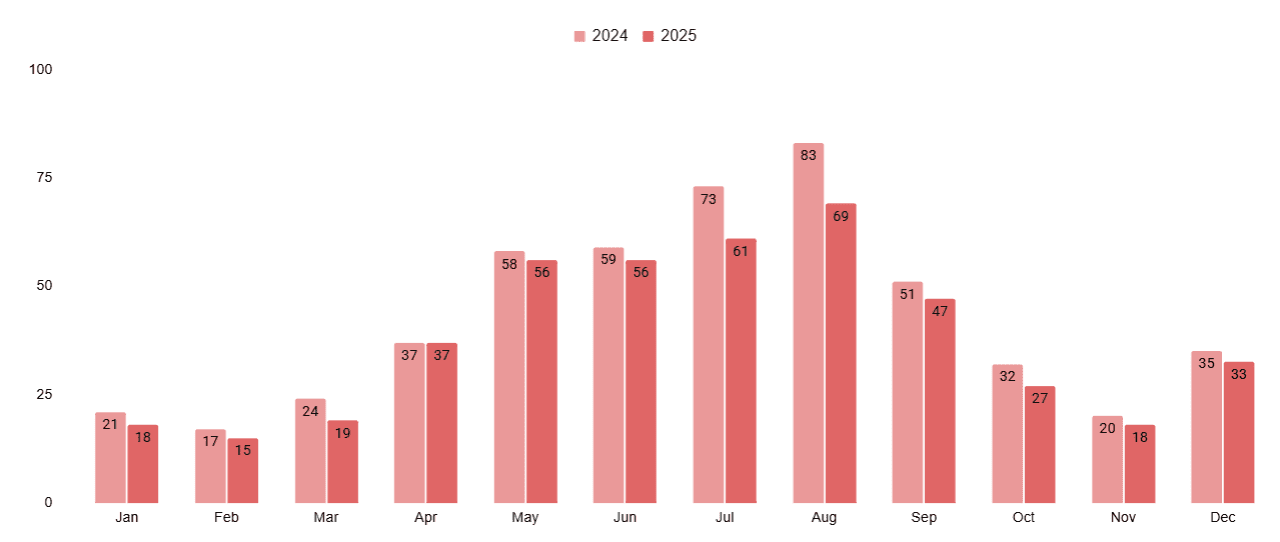
Realized Occupancy Peaks (2025):
- Highest Demand: August reached 79%, followed by July at 74%.
- Quiet Season: January and February remain the lowest, averaging 43-47%.
3. Seasonality and the “Booking Cliff.”
The ASSC Barometer shows that 47% of operators report winter bookings are “much worse” than last year, describing demand as having “dropped off a cliff.” However, PriceLabs data reveals that this “cliff” is actually a shift in the clock, not just a loss in volume.
- The Trend: Lead Times are Shrinking. Across Scotland, the average booking window has tightened to 38 days (down from 43 in 2024). This compression is most extreme during the shoulder season. For example, in February and March, the median booking window collapses to just 15–17 days.
- The “Wait-and-See” Guest: Analysis of 2025 performance shows that even in the quietest months, demand exists—it simply arrives at the eleventh hour.
- January & December: Guests are waiting until the final 15–18 days to commit.
- The Last-Minute Surge: According to current PriceLabs pacing, last-minute bookings (0–7 days before arrival) now account for 27% of all revenue.
- The Strategy: Avoid “Price Panic.” Seeing a “dead” calendar three weeks out often triggers a sudden, drastic rate drop. But the data shows that the Average Length of Stay (LOS) has remained remarkably consistent at 4 nights throughout the year.
Instead of slashing your base rate and devaluing your brand, use Dynamic Minimum Stays to bridge the gap:
- Capture “Orphan Gaps”: With a consistent 4-night average, your calendar will naturally develop 1- or 2-night “orphans.” Use dynamic rules to automatically lower your minimum stay restrictions only for these specific gaps, filling them at a premium last-minute rate.
- Tiered Lead-Time Rules: Maintain a 4-to-5 night minimum for bookings made 30+ days out. Within the 14-day window—where the bulk of your 2026 demand now sits—automatically relax to a 2-night minimum to capture the “spontaneous traveler.”
By aligning your stay restrictions with the 15-day booking reality, you capture the late-stage demand without sacrificing the high-value, long-stay revenue that still forms the backbone of the Scottish summer.
4. The “Levy Effect”: Edinburgh’s July Launch
To truly understand the“Levy Effect,” property managers must look beyond the 5% tax and focus on the 5-night cap. Because the levy applies only to the first five nights, it creates a strategic opportunity to steer guest behavior toward stays that significantly boost your net profit.
Here is how to use Length of Stay (LOS) as a “shield” for your margins:
1. Leverage the “Tax-Free” Psychology
For a guest staying 7 nights, the final two are effectively tax-free. Shift the narrative: instead of a generic discount, market the stay as “Levy-Capped: Stay 5, Get the rest Levy-Free.” This reframes the tax from a burden into a value proposition for longer stays, attracting higher-value travelers.
2. Boost Operational Efficiency
Turnover is your highest hidden cost (cleaning, laundry, and admin).
- Two 3-night stays: Require two full turnovers and a 5% levy paid on all 6 nights.
- One 6-night stay: Requires one turnover, and the levy is paid on only 5 nights.
By setting a 5-night minimum during peak periods like August, you eliminate 50% of your turnover overhead. This saving often far outweighs the 5% levy, leaving you with a higher net margin.
3. Implement Dynamic LOS Pricing
Avoid flat rules. Use technology to be aggressive:
- Peak Demand: Mandate a 5-night minimum to align with the cap and ensure every guest is “low-turnover.”
- Orphan Gaps: For a 3-night gap, lower the minimum stay but increase the nightly rate. The higher rate covers the operational “inefficiency” of a short stay, while the guest covers the full levy.
4. Optimize Admin Recovery
The City of Edinburgh allows you to retain 2% of the levy collected for admin costs. One 7-night booking is administratively cheaper to process than three 2-night bookings. Favoring larger transactions reduces your credit card fees and the labor required to manage per-pound earnings.
| Stay Length | Levy Applied | Operational Burden | Strategic Advantage |
| 1–4 Nights | 5% on all nights | High | Requires premium ADR to offset turnover. |
| 5 Nights | 5% on all nights | Moderate | The efficiency “sweet spot” for council revenue. |
| 6+ Nights | Capped (No levy after night 5) | Low | Highest Net Margin: Maximum profit per booking. |
5. Protecting the Bottom Line: Occupancy vs. RevPAR
In 2026, 100% occupancy is often a sign of underpricing. Given that 91% of ASSC survey respondents cite the cost of doing business as a major challenge, every booking must be profitable. The results say “Rising cost of doing business – 91% say this is a moderate to major challenge (55.52% major) with only 1.62% saying this is not a challenge.”
- The Logic: If your “Cost Per Occupied Room” (CPOR) has jumped 20% due to rising energy rates and the NDR revaluation, a £150 booking that was profitable in 2024 might be a loss-maker in 2026.
- The Playbook Move: Set a “Hard Floor Price.” Factor in your new 2026 business rates and cleaning fees. If the market won’t meet that price, it is often better for your long-term asset health to leave the unit empty than to subsidize a guest’s stay at a loss.
6. The Competitive Edge: Dynamic Pricing Adoption
The gap between “hobbyist” hosts and professional managers is widening. Properties utilizing sophisticated pricing strategies are significantly outperforming the market average.
| Dynamic Pricing Adoption Level | # of Listings | Market Distribution (%) | Occupancy Rate (%) |
| Moderate | 7,381 | 24% | 51% |
| High | 4,110 | 14% | 49% |
| Low | 8,346 | 28% | 49% |
| None (Static) | 10,298 | 34% | 37% |
| Null/Unknown | 335 | 1% | 43% |
As we head into the peak of 2026, the data shows that properties using high levels of dynamic pricing aren’t just getting more bookings—they are capturing higher-value demand.
- Maximum Occupancy: Properties with High or Moderate adoption see a staggering 49–51% occupancy rate for December, compared to just 37% for those with no strategy.
- Revenue Efficiency: While “High” adoption captures slightly less volume than “Moderate” (14% vs 24% distribution), it maintains a robust 49% occupancy, suggesting these managers are pushing rates higher during peak demand rather than just filling beds at any cost.
- The “Static” Penalty: Listings with no dynamic pricing represent 34% of the market but have the lowest occupancy (37%). In a high-cost environment like 2026, these “static” listings are likely operating below their breakeven point.
Conclusion: Data-Backed Advocacy
The Scottish self-catering market is maturing. Success in 2026 requires a two-pronged approach:
- Engagement: Supporting ASSC’s work to secure fair regulation and the introduction of a profitability-based approach to Non-Domestic Rates valuation.
- Intelligence: Using PriceLabs to ensure that every booking made is contributing to a healthy, sustainable margin.
By layering regional advocacy with global data insights, Scottish property managers can do more than just weather the storm—they can lead the way.