
Table of Contents
Updated : Apr 6, 2026
In the highly competitive world of short-term rentals (STRs), simply checking your bank account isn’t enough to secure long-term success. To genuinely maximize your earnings and stay ahead, you need to become fluent in the language of data. That language is spoken through Key Performance Indicators (KPIs), which are absolutely crucial for effective rental revenue optimization.
These vacation rental KPIs act as your navigational tools, transforming complex market data into clear, actionable insights. Whether you manage a cozy single property or a rapidly expanding portfolio, mastering these metrics is how you move from guessing games to strategic, data-driven decisions.
This guide breaks down the 10 essential vacation rental revenue management metrics every professional revenue manager needs to track, helping you focus on what truly drives profitability.
Part 1: The Core Revenue Engine: Price, Occupancy, and Performance
These foundational metrics tell the complete story of your inventory utilization and pricing power.
1. Occupancy Rate (OR): How Full is Your Property?
The occupancy rate is the starting point for any analysis. It tells you exactly how effectively you are utilizing your available inventory, directly impacting your cash flow. It’s fundamental for understanding seasonal dips and identifying opportunities to fill gaps.
What it Measures: The percentage of occupied rooms divided by the total number of available rooms.
The Calculation:
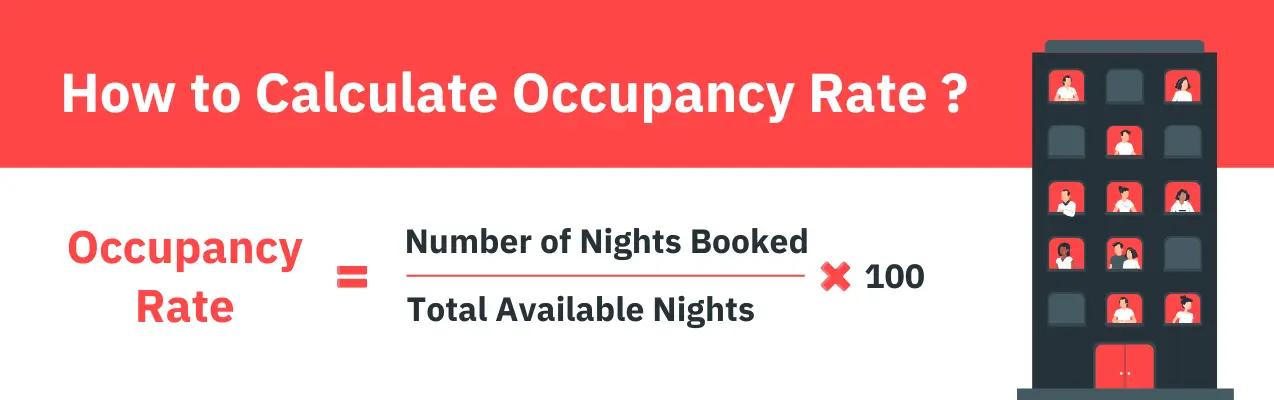
Example: If 60 out of 100 available nights are booked, your occupancy rate is 60%.
A Pro Tip: Always calculate your Adjusted Occupancy Rate. This metric excludes nights blocked for owner use or maintenance, giving you a far more accurate view of how you perform during periods when your property is genuinely on the market. Including this in your calculations is essential for accurate pricing decisions.
Bonus Read: Vacation Rental Revenue Management: The Complete Guide for Hosts and Property Managers
2. Average Daily Rate (ADR): Are You Charging Enough?
The Average Daily Rate (ADR) is the primary measure of your pricing effectiveness. It answers the question: “How much revenue are we generating for every night the property is occupied?” It helps property managers optimize pricing strategies to maximize revenue.
What it Measures: Total room revenue divided by the total booked nights.
The Calculation:

Example: If you generated $3,000 from 20 occupied nights, your ADR is $150.
In the world of dynamic pricing for vacation rentals, the system is continuously working to optimize your ADR by reacting to real-time market data, competitor pricing, and demand spikes. However, aggressive pricing must be balanced; pricing too high can reduce booking volume and hurt overall revenue.
Start Your Rental Revenue Optimization Journey Today
Ready to transform your pricing strategy from guesswork to data-driven precision?
Gain an Edge in Your Local Market with PriceLabs Dynamic Pricing Tool and eliminate the complexity of market analysis and leverage AI-powered pricing to achieve optimal ADR and Occupancy.
3. Revenue per Available Room (RevPAR): The Ultimate Health Check
Revenue per Available Room (RevPAR) provides the most comprehensive view of your property’s overall performance because it combines both pricing effectiveness (ADR) and utilization (Occupancy Rate) into a single metric. If you only track one KPI, make it RevPAR.
What it Measures: Overall property profitability for every single night, whether it was booked or not.
The Calculation (The Easiest Way):

Alternatively: RevPAR=Total Available Nights/Total Revenue
Example: With an ADR of $150 and an Occupancy Rate of 60%, your RevPAR is $150 × 0.60 = $90.
RevPAR excellence means finding the sweet spot between high pricing and high occupancy. Analysing this vacation rental revenue management metric helps you instantly see whether a pricing change worked: did the ADR rise enough to offset a slight dip in occupancy, ultimately raising the RevPAR?
Part 2: Operational & Guest Experience KPIs
These metrics focus on efficiency, guest happiness, and securing repeat business—the keys to long-term success.
4. Average Length of Stay (ALOS)
The Average Length of Stay (ALOS) (also known as LOS) significantly impacts both operational costs and revenue predictability. Longer stays reduce your operational overhead per night by reducing turnovers, cleanings, and maintenance checks.
What it Measures: The number of nights a customer stays in a vacation rental property.
The Calculation:

Key Action: Analyzing LOS patterns by season and lead time helps owners optimize pricing and inventory control. You can then use your platform’s tools to set strategic minimum-stay requirements and attract segments such as digital nomads. The PriceLabs Market Dashboard provides charts that enable you to compare your minimum stay restrictions with the average Length of Stay (LOS) in your local region during different seasons
5. Guest Satisfaction Score
Your Guest Satisfaction Score—derived from reviews and ratings—is a powerful tool. It directly influences your property’s online visibility, booking conversion rates, and the critical potential for repeat bookings.
The Calculation:
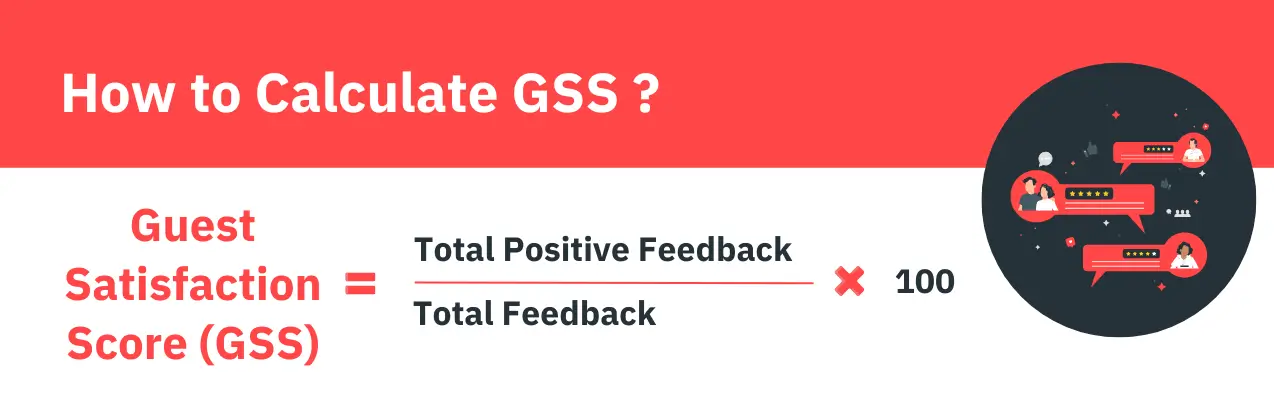
Impact: Properties with consistently high ratings can command higher ADRs and achieve higher occupancy rates. Positive reviews and ratings help build credibility for future customers.
Monitoring: Track scores daily from all major OTAs (Airbnb, Vrbo, Booking.com).
This KPI helps you proactively identify operational flaws, such as slow maintenance response times or missed cleaning details, before they cause lasting revenue damage.
6. Cancellation Rate
The Cancellation Rate indicates booking stability and revenue predictability. A high rate can significantly harm both revenue and guest trust.
The Calculation:
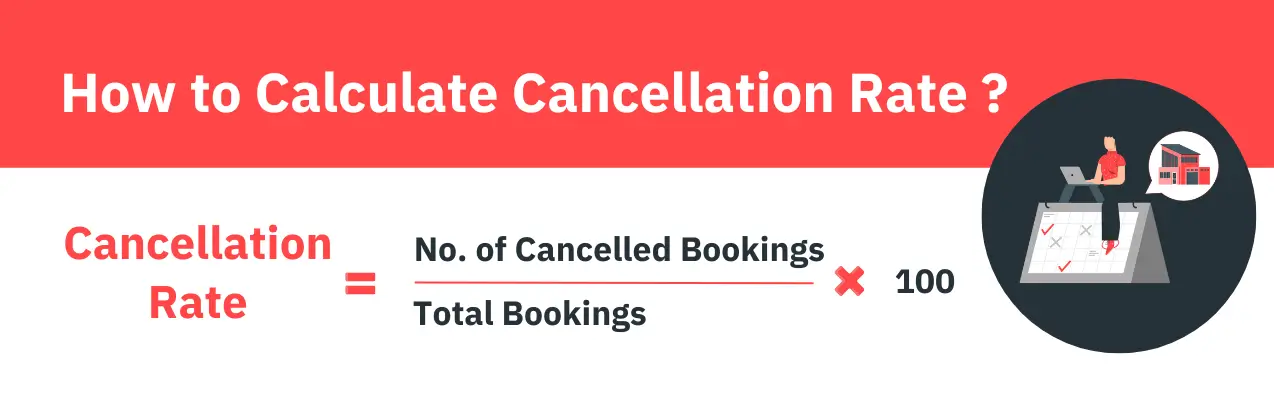
The Fix: Analyse data on cancellation policies to ensure yours align with market trends and attract bookings. A lack of a flexible cancellation policy can be a common cause of a high cancellation rate.
7. Inquiry-to-Booking Rate
This metric measures the efficiency of your sales funnel. It shows how effectively you convert initial interest (a message or inquiry) into a confirmed reservation.
The Calculation:
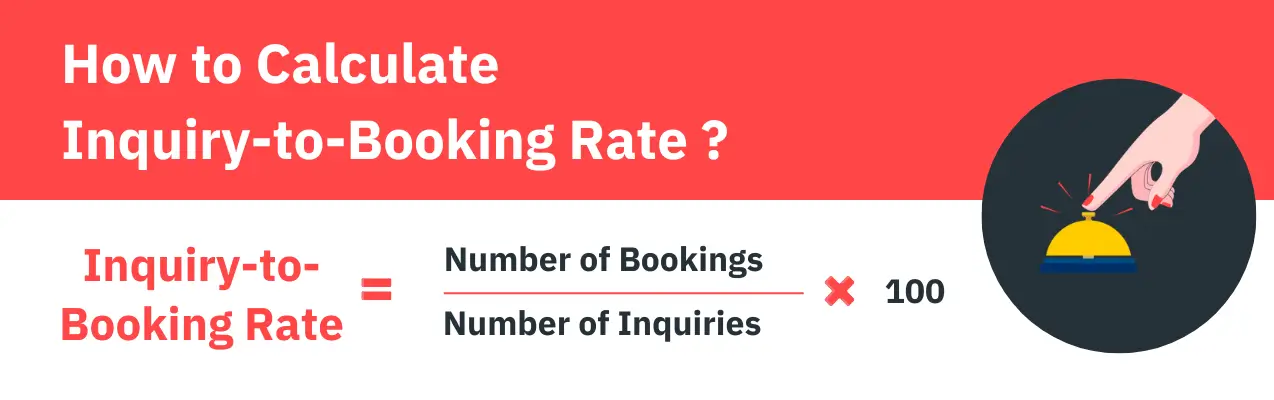
Strategies for Improvement: Implementing automated messaging tools to send pre-arrival instructions and check-in details can help. Promptly responding to guest inquiries, ideally within an hour, is important to build a positive first impression.
8. Direct Bookings
Direct Bookings are essential for rental revenue optimization. These are reservations made through your own direct booking website or private channels, and they are pure profit.
- Benefit: Direct bookings eliminate commission fees entirely, drastically improving your profit margins. They also give you better customer data, which you can use for personalized marketing and lucrative loyalty programs.
- The Value: The average value of a direct booking is more than twice that of a booking made through Airbnb.
Part 3: Financial Health & Marketing Metrics
These KPIs focus on the overall financial sustainability and cost efficiency of your entire STR operation.
9. Net Operating Income (NOI)
Net Operating Income (NOI) serves as the central measure of property-level profitability. It provides the foundation for sound financial decision-making and understanding your property’s true profit potential.
The Calculation:
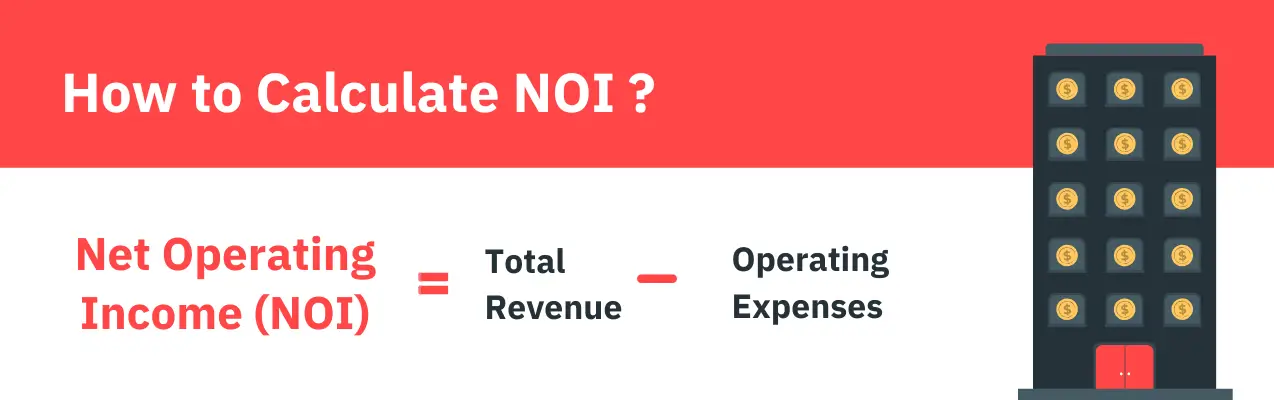
Note: While NOI is related to ROI, the core concept is tracking income versus operating expenses.
Operating Expenses Include: Property management fees, cleaning and maintenance costs, marketing, utilities, vacation rental insurance, and property taxes.
NOI analysis helps identify operational inefficiencies and compare the performance of different properties within your portfolio.
10. Customer Acquisition Cost (CAC)
The Customer Acquisition Cost (CAC) measures the expense of acquiring each new guest, making it vital for evaluating your marketing Return on Investment (ROI) and long-term profitability.
The Calculation:

Strategies for Reduction: Encouraging repeat bookings through incentives and personalized experiences can help reduce costs. Optimizing for local SEO can also generate high-value organic traffic.
How to Master KPIs with Dynamic Pricing for Vacation Rentals
You cannot manage these 10 metrics manually. That’s why dynamic pricing for vacation rentals is the industry standard—it integrates the KPIs into an automated system.
PriceLabs Dynamic Pricing: Optimizing Revenue with Key Metrics
PriceLabs is a revenue management solution that automatically tracks, analyzes, and leverages these essential vacation rental KPIs across your entire portfolio. The dynamic pricing system continuously monitors market metrics, ensuring that per-night pricing is competitive yet profitable.
Dynamic pricing for vacation rentals enables property managers to optimize revenue and occupancy rates from afar. This data-driven approach removes all pricing guesswork and manual adjustments, allowing you to focus on the strategic oversight that truly generates profit. Using data reporting tools like PriceLabs Dynamic Pricing to analyse and draw insights from your data helps revenue managers make informed strategic decisions.

Turning Data into Action
To effectively use your vacation rental KPIs:
- Track Daily and Weekly: Track key performance metrics, such as occupancy rates, rental income, and RevPar, to evaluate the success of your management strategies.
- Set Benchmarks: Establish clear targets and compare your property’s performance against the market average.
- Proactive Adjustment: Leverage future pricing graphs to understand how property managers price their accommodations. Use real-time data to adjust prices quickly and nimbly.
Monitoring these metrics uncovers both quick wins (tactical pricing adjustments) and long-term strategies (improving guest satisfaction that drives sustainable revenue growth).
The Bottom Line
Mastering these 10 vacation rental revenue management metrics is the essential difference between simply managing a property and strategically growing a business. By adopting a system that integrates these vacation rental KPIs into a dynamic strategy, such as dynamic pricing for vacation rentals, you can ensure sustainable growth and achieve market leadership.
Frequently Asked Questions
What are the most important KPIs for rental revenue optimization?
The most important vacation rental KPIs for revenue optimization include Occupancy Rate, Average Daily Rate (ADR), and Revenue per Available Room (RevPAR). These three are crucial for assessing profitability, while Direct Bookings and the Guest Satisfaction Score determine your long-term health and market reputation.
How do I calculate key vacation rental KPIs?
The core KPIs are straightforward:
- Occupancy Rate equals (Number of Nights Booked ÷ Total Available Nights) ×100.
- ADR is Total Room Revenue ÷ Total Booked Nights.
- RevPAR is calculated by dividing the average daily rate by the total number of rooms booked.
How often should I monitor these vacation rental revenue management metrics?
You should track core revenue metrics, such as occupancy rate and ADR, at least weekly. Strategic metrics should be reviewed monthly or quarterly to inform strategic, long-term decisions and capitalize on data-driven insights.
How can I improve my vacation rental KPIs effectively?
The most effective way is by implementing dynamic pricing for vacation rentals to optimize RevPAR. Additionally, enhancing the guest experience is essential to generate positive reviews and repeat bookings, which boost credibility and occupancy rates.