Table of Contents
Updated : Apr 14, 2026
Many short-term rental investors wrestle with the same foundational question: Should I chase the right city or the right property type? Picture a downtown studio in Austin versus a lakefront home near Orlando — both sound promising, but one will almost certainly outperform the other once you factor in seasonality, local demand curves, and competitive density.
The problem is that most investors rely on citywide averages, anecdotal advice, or static spreadsheets to make this decision. That approach misses the micro-market dynamics that ultimately determine whether a property generates $3,000 or $7,000 a month.
PriceLabs solves this with a connected suite of data tools — the free Revenue Estimator, Revenue Estimator Pro, Market Dashboards, and Dynamic Pricing — that turn address-level short-term rental data into actionable investment intelligence. This article walks through how each tool contributes to the city-versus-property-type decision, complete with real market data pulled from the PriceLabs STR Index.
The Metrics That Actually Drive Airbnb Income
Before comparing cities or property types, you need to understand the three metrics that define short-term rental performance:
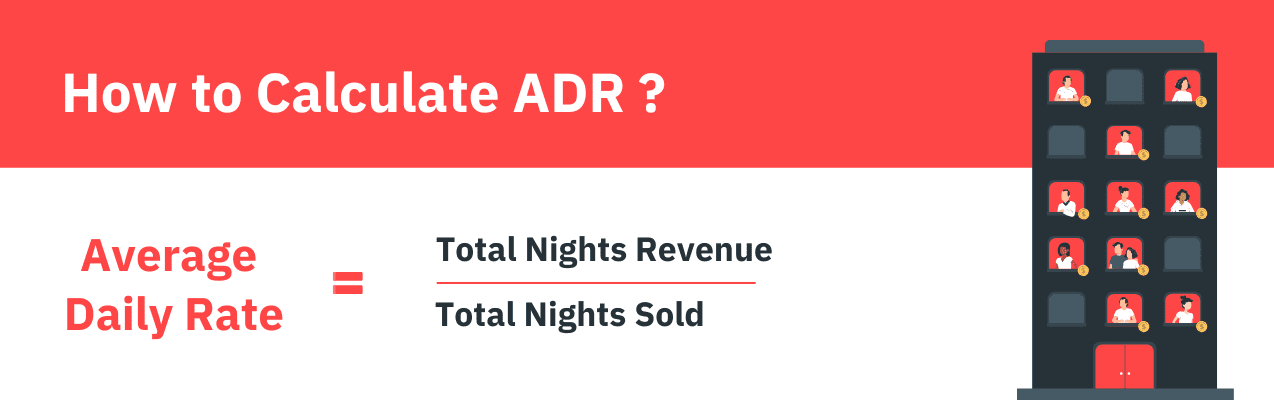
1. Average Daily Rate (ADR) is the average amount earned per booked night. A higher ADR means you’re commanding premium pricing — but it means nothing if the property sits empty half the month.
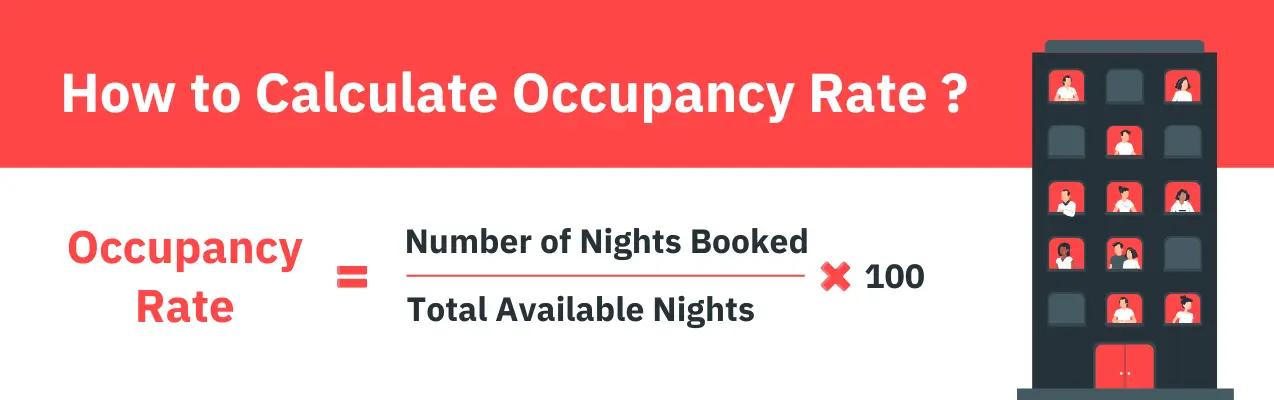
2. Occupancy Rate measures the percentage of available nights that are actually booked. Strong occupancy signals consistent demand, but chasing 100% occupancy often means you’re underpricing.
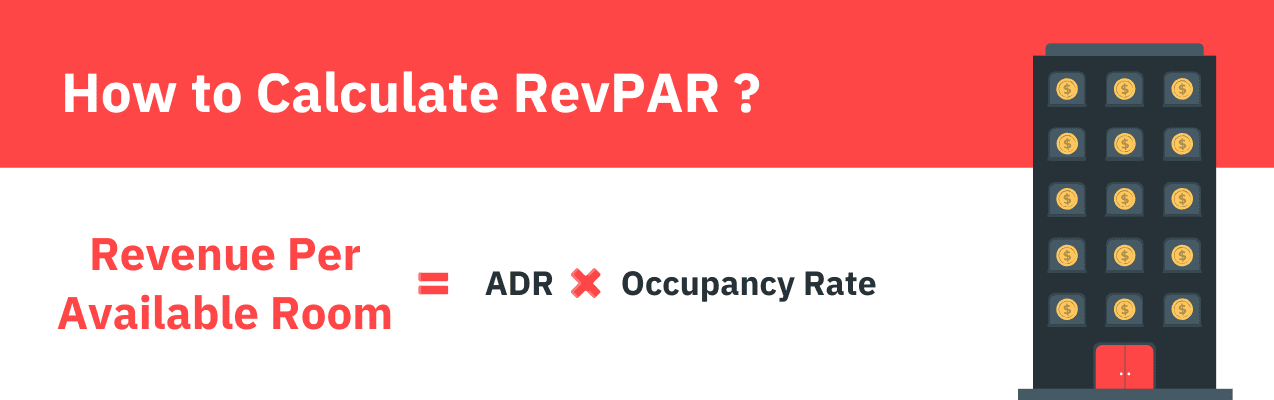
3. Revenue Per Available Room (RevPAR) is the metric that ties the other two together. It divides total revenue by all available nights — booked or not — giving you the truest single measure of how well a property converts its calendar into income. A property with a $300 ADR and 40% occupancy earns a RevPAR of $120. A property with a $180 ADR and 75% occupancy earns a RevPAR of $135 — quietly outperforming despite the lower nightly rate.
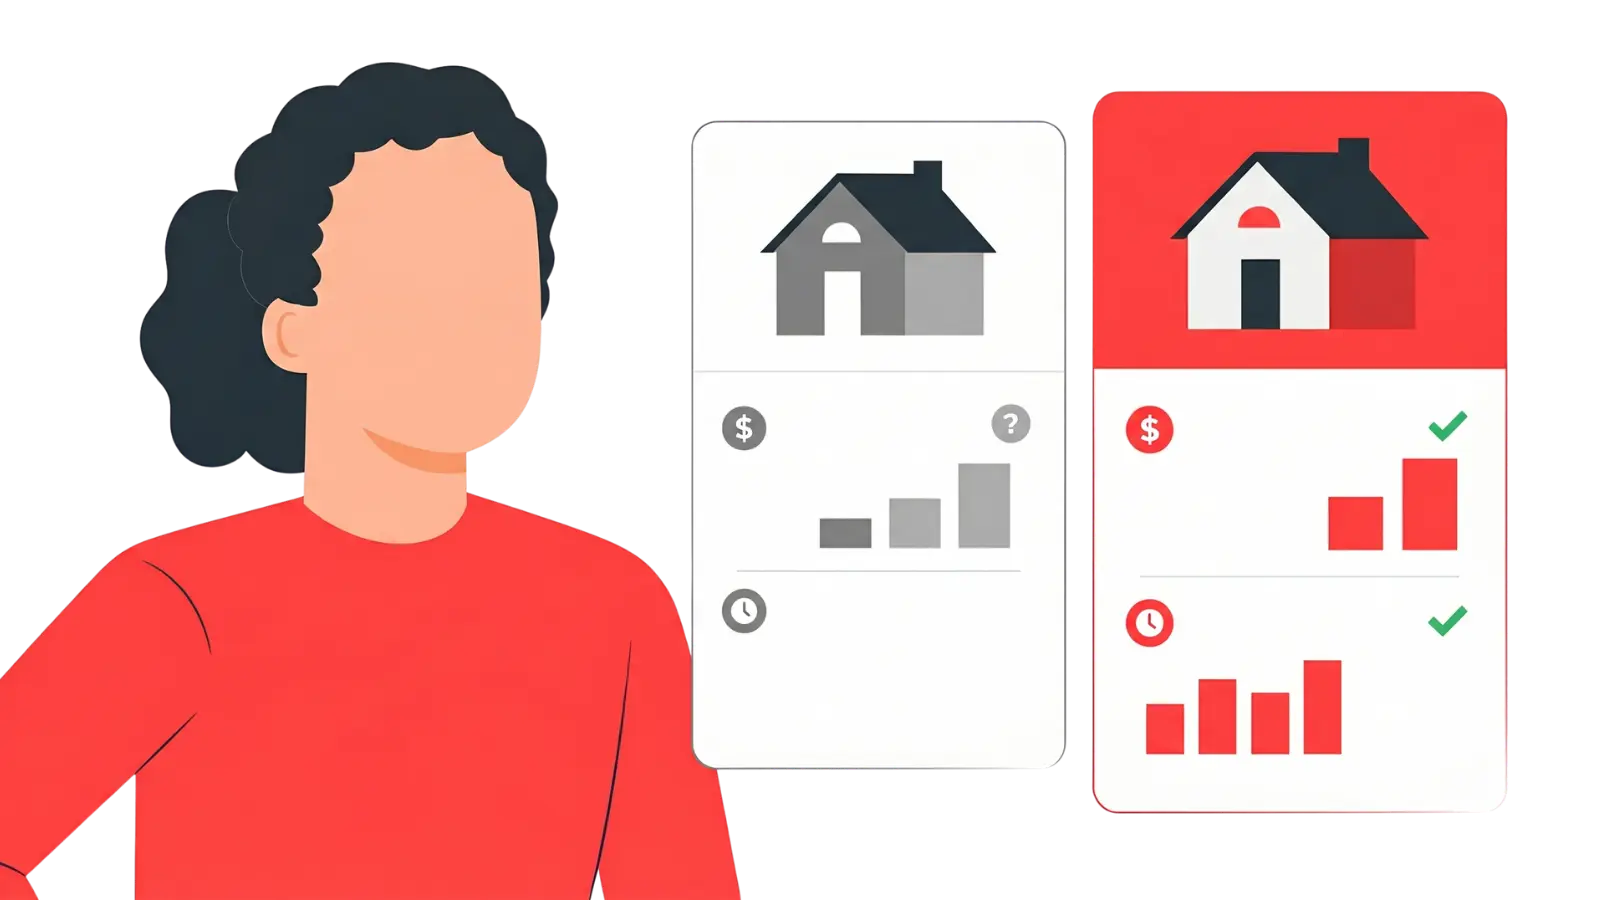
This is why citywide ADR rankings can be misleading. Two identical apartments in the same city can earn dramatically different amounts depending on walkability, proximity to attractions, local event calendars, and even the density of competing listings on the same block. Precision at the neighborhood and address level is what separates a confident investment from an expensive guess.
Why the City-Versus-Property-Type Decision Shapes Everything
The interplay between where you invest and what you invest in defines both your revenue ceiling and your risk profile.
City-level dynamics include traveler demographics, regulatory environments, seasonal demand patterns, and supply growth. A market with aggressive short-term rental regulations (like parts of New York or Los Angeles) introduces compliance risk that doesn’t exist in more permissive markets, such as the Smoky Mountains or Gulf Shores.
Property type dynamics — whether you choose a studio, a one-bedroom condo, or a four-bedroom house — affect your target guest segment, your average booking window, and your sensitivity to seasonality. Smaller units tend to attract business travelers and weekend visitors, delivering steadier year-round occupancy. Larger homes attract families and groups, commanding higher nightly rates but often experiencing steeper off-season dips.
The same property type placed in these two states would produce entirely different cash flow profiles across the year. The city decision isn’t just about which market earns more on average — it’s about which market’s seasonal rhythm aligns with your investment strategy.
Dynamically Price Your Property and Get FREE Custom Reports Tailored To Your Property!
Use PriceLabs Dynamic Pricing to competitively and dynamically price your property according to demand shifts and analyze past performance to set a strong pricing strategy for your property.
Create your Account NowHow PriceLabs Tools Work Together for This Decision
PriceLabs doesn’t offer a single “income calculator” — it offers an integrated ecosystem in which each tool addresses a different layer of investment analysis. Here’s how they fit together.
The Free Revenue Estimator: Your Starting Point
The PriceLabs Revenue Estimator is a free, online tool available at pricelabs.co that generates projected revenue, ADR, and occupancy for any address. You enter a location, select a currency and bedroom count, and get an instant estimate based on live and historical Airbnb data.
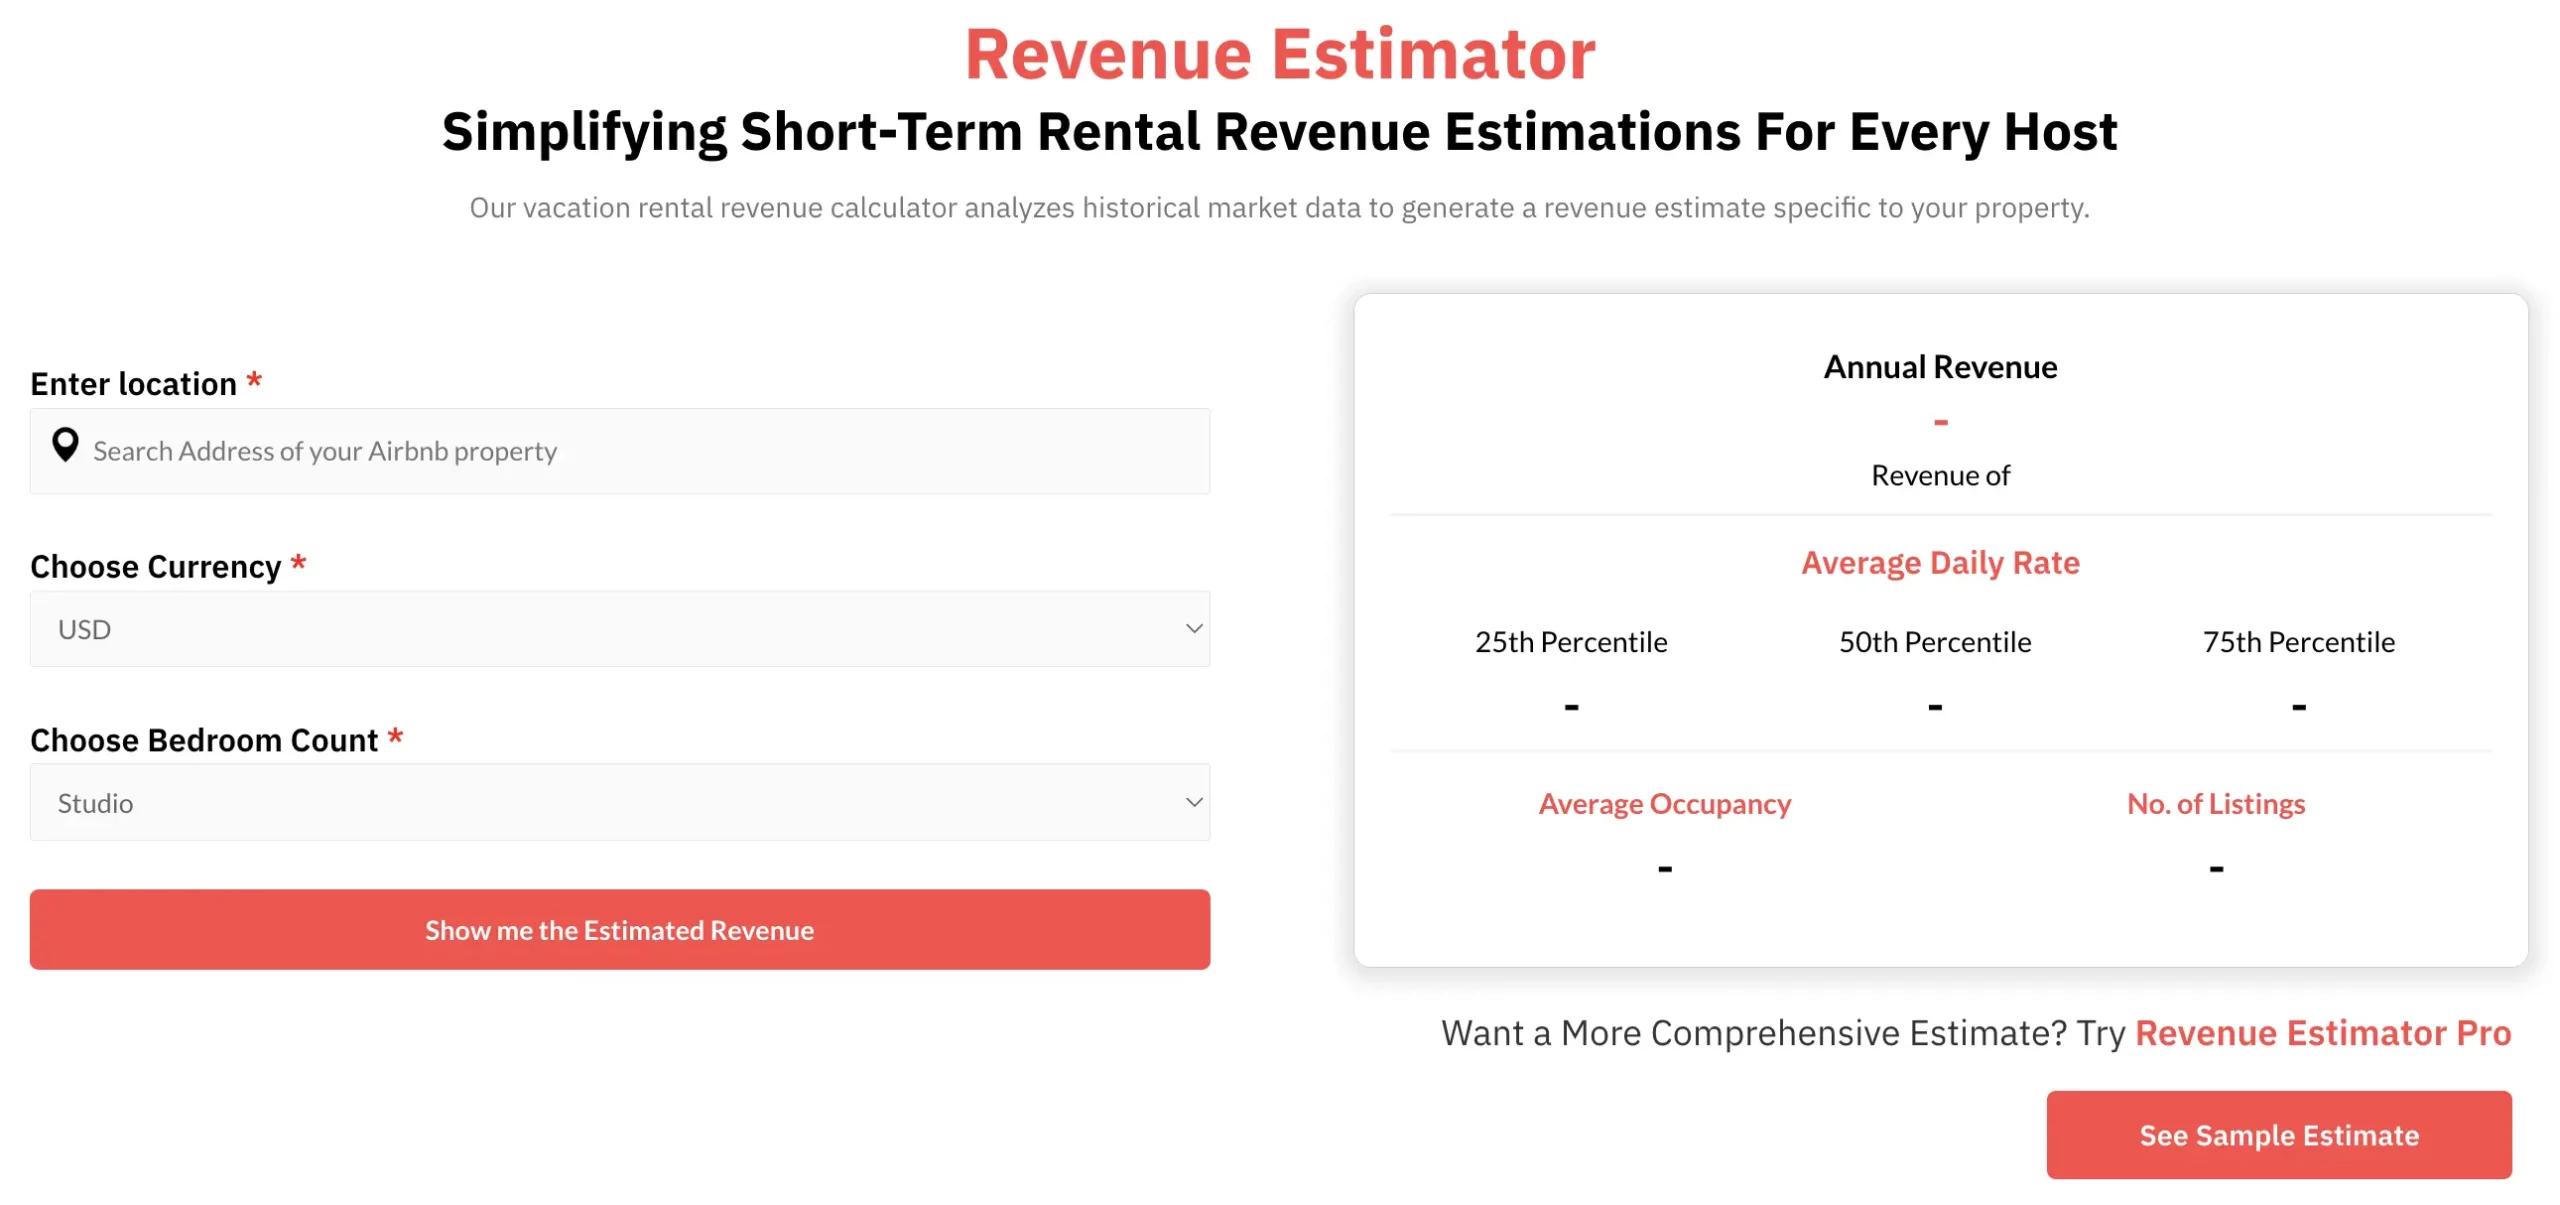
This is the right starting point when you’re screening multiple cities or neighborhoods at a high level. It costs nothing, requires no account setup, and delivers a directional answer within seconds: “Is a two-bedroom in Austin even in the same ballpark as a two-bedroom in Denver?”
Revenue Estimator Pro: Deep, Customizable Projections
When you’ve narrowed your shortlist, Revenue Estimator Pro takes analysis to a different level. It collects data from up to 350 active listings within a 15 km radius of your target address (expanding up to 35 km in lower-density markets), scrubs anomalies from the dataset, and produces detailed monthly and annual projections for revenue, ADR, and occupancy.
What makes Revenue Estimator Pro especially powerful for the city-versus-property-type question:
- Bedroom category comparisons. Run separate estimates for a studio, a two-bedroom, and a four-bedroom at the same address. The tool shows percentile breakdowns (25th, 50th, and 75th) for each configuration, so you can see not just the median expectation but the realistic upside and downside.
- Amenity impact analysis. Compare a two-bedroom with a pool against a two-bedroom without one at the same location. This reveals whether a specific amenity justifies its cost in a given market.
- Comp set refinement. The default comp set is algorithmically generated, but you can filter by location zones, review quality, specific amenities, and performance tiers. You can even hand-pick individual comparable listings from a map view to build a perfectly tailored benchmark.
- Downloadable PDF reports. Each estimate can be exported as a branded PDF — useful for pitching property owners, sharing with investment partners, or documenting your due diligence.
For example, to decide between a two-bedroom condo in Denver versus a three-bedroom house in Phoenix, you’d run two Revenue Estimator Pro estimates — one for each address and bedroom count — and compare the monthly revenue curves side by side. Colorado’s dual-peak pattern ($219 RevPAR in February, $192 in July) versus Arizona’s winter-weighted curve ($106 RevPAR in December, dropping to $71 in August) would be immediately visible.
Dynamically Price Your Property and Get FREE Custom Reports Tailored To Your Property!
Use PriceLabs Dynamic Pricing to competitively and dynamically price your property according to demand shifts and analyze past performance to set a strong pricing strategy for your property.
Create your Account NowCity and Neighborhood Intelligence with Market Dashboards
Market Dashboards provide the macro context that individual property estimates can’t. They’re fully automated, personalized dashboards that track a location’s short-term rental booking data through a series of analytical views.

Key capabilities for investment comparison:
- KPI tracking across estimated revenue, RevPAR, occupancy, ADR, booking counts, average booking window, and average length of stay.
- Supply and demand analysis showing how many listings are active in a market, how fast supply is growing, and whether demand is keeping pace.
- Future occupancy and pricing trends that project forward-looking demand signals — not just historical performance.
- Day-of-week pricing and occupancy patterns that reveal whether a market is weekday-driven (business travel), weekend-driven (leisure), or balanced.
- Amenity prevalence analysis showing what percentage of listings in a market offer pools, hot tubs, pet-friendliness, and other features — helping you identify amenity gaps you could exploit.
- Custom comp sets that let you narrow analysis to a specific group of comparable listings based on location, bedroom count, amenities, reviews, pricing, and more.
- PDF export for sharing analysis with stakeholders.
When evaluating cities, Market Dashboards answer questions like: “How competitive is the two-bedroom segment in Austin compared to Nashville?” or “Is supply growth in Florida outpacing demand growth?” These are the structural questions that determine whether a market is getting more attractive or more saturated over time.
Dynamic Pricing: Where Strategy Meets Execution
Once you’ve chosen a city and property type, Dynamic Pricing ensures you actually capture the revenue your market analysis projected. PriceLabs Dynamic Pricing starts with your listing’s Base Price, then applies market-driven adjustments daily — factoring in local demand shifts, day-of-week patterns, seasonal trends, and competitive pricing movements — and syncs optimized nightly rates directly to your connected PMS, Airbnb, or Vrbo calendar.

Supporting features within Dynamic Pricing:
- Base Price Help analyzes nearby listings (especially those with similar bedroom counts) and suggests a starting Base Price. It also supports a market-driven base-price model that adjusts dynamically based on factors such as your listing’s performance, review scores, physical attributes, and fee structure.
- Dynamic minimum stay recommendations help you balance occupancy against turnover costs. A one-bedroom urban apartment might benefit from a one-night minimum to maximize fill rate, while a four-bedroom mountain cabin might perform best with a three-night minimum that attracts higher-value bookings and reduces cleaning costs.
- Customizations and overrides let you set date-specific adjustments for local events, last-minute discounts to fill gaps, and far-out premiums to capture early bookers willing to pay more.
Dynamically Price Your Property and Get FREE Custom Reports Tailored To Your Property!
Use PriceLabs Dynamic Pricing to competitively and dynamically price your property according to demand shifts and analyze past performance to set a strong pricing strategy for your property.
Create your Account NowWhat the Data Won’t Tell You
PriceLabs tools are powered by real booking data and sophisticated algorithms, but they work best when paired with local knowledge and operational awareness.
Regulations aren’t embedded in revenue estimates. A city might show strong projected revenue, but local short-term rental ordinances — permit caps, zoning restrictions, occupancy taxes — can meaningfully alter your net return. Always research local regulations independently.
Operating costs vary. Revenue Estimator Pro projects gross revenue based on nightly rates, excluding cleaning fees, platform service fees, and local taxes. Your net income will depend on your management structure, cleaning costs, maintenance expenses, and software subscriptions. Always build a full expense model alongside your revenue projections.
Emerging markets may have thinner data. PriceLabs estimates are most reliable in data-rich markets with robust listing density. In smaller or newer markets, comp sets may be smaller, and projections may carry wider confidence bands. The tool flags low sample sizes (under 30 listings) so you know when to apply extra scrutiny.
Unique property attributes matter. A listing with exceptional design, professional photography, and a curated guest experience can significantly outperform market averages. Conversely, a poorly maintained or generically furnished property will underperform even in a strong market. Data gives you the baseline — execution determines where you land within the range.
Why Data Precision Wins
The difference between a successful short-term rental investment and a disappointing one often comes down to whether the investor made decisions based on neighborhood-level data or city-level assumptions. A two-bedroom in downtown Austin and a two-bedroom in suburban Austin can differ by $1,500 or more in monthly revenue. A three-bedroom with a pool in Scottsdale and one without can differ by thousands annually. These are differences that only surface when you analyze at the address level.
PriceLabs gives you that precision — from the free Revenue Estimator for initial screening, to Revenue Estimator Pro for detailed property-level projections, to Market Dashboards for market-wide competitive intelligence, to Dynamic Pricing for ongoing revenue optimization. Together, they form a complete decision framework that replaces guesswork with evidence at every stage of the investment lifecycle.
Whether your next investment is in the right city, the right property type, or both, the answer is in the data.
Frequently Asked Questions
How accurate is PriceLabs Revenue Estimator Pro for predicting Airbnb revenue?
Revenue Estimator Pro analyzes up to 350 active nearby listings using scrubbed, year-long booking and pricing data to produce monthly and annual projections. Accuracy depends on local listing density and data quality — the tool is most reliable in established markets with 30 or more comparable listings and flags lower-confidence estimates when sample sizes are small.
What inputs do I need to compare income potential between cities or property types?
At minimum, you need each property’s address and bedroom count. For more refined comparisons in Revenue Estimator Pro, you can add amenity filters (pool, hot tub, pet-friendly), adjust the comparable radius, and hand-pick individual comp listings from a map to ensure you’re comparing like-for-like.
Does Revenue Estimator Pro account for taxes, regulations, or operating costs?
No. Projections are based on gross revenue derived from displayed nightly rates on Airbnb, excluding cleaning fees, platform service fees, and local taxes. You should factor in permitting costs, occupancy taxes, management fees, and maintenance expenses separately when calculating net returns.
How does PriceLabs handle market seasonality in its estimates?
Revenue Estimator Pro generates month-by-month revenue, ADR, and occupancy projections that reflect seasonal demand patterns in your specific market. Market Dashboards and the STR Index provide additional seasonal views — including day-of-week patterns, booking window trends, and year-over-year comparisons — so you can see exactly how performance fluctuates across the calendar.
What’s the difference between the free Revenue Estimator and Revenue Estimator Pro?
The free Revenue Estimator provides a quick, high-level revenue estimate for any address based on location, currency, and bedroom count — no account required. Revenue Estimator Pro offers a much deeper analysis: up to 350 comparable listings, monthly breakdowns with 25th/50th/75th percentile ranges, customizable comp sets with amenity and location filters, map-based comp selection, and downloadable branded PDF reports.
How often should I revisit my pricing strategy and market analysis?
Review Dynamic Pricing settings and Market Dashboard trends at least monthly. Recalibrate your base price and minimum stay rules whenever you notice demand shifts, new competition, seasonal transitions, or after accumulating enough reviews to reposition your listing in the market.