
Table of Contents
Updated : Apr 3, 2026
For hosts across Southeast Asia, the post-pandemic travel boom has been a double-edged sword. While travelers are returning in droves, many property owners are discovering a frustrating reality: The Southeast Asia Paradox. Despite similar seasonality, events, and travel behaviors across the region, revenue often fails to keep pace with demand. Performance diverges significantly because management decisions do so as well.
If you feel like your revenue is plateauing while the market is surging, you aren’t alone. Data shows a recurring pattern across Thailand, Malaysia, and Indonesia where wide gaps in Average Daily Rate (ADR), Revenue Per Available Room (RevPAR), and occupancy remain.
The good news? There is a massive room for growth. More than 50% of properties in the region do not yet utilize dynamic pricing. This represents a significant opportunity for hosts to gain a competitive edge by moving from market signals to revenue intelligence.
Dynamically Price Your Property and Get FREE Custom Reports Tailored To Your Property!
Use PriceLabs Dynamic Pricing to competitively and dynamically price your property according to demand shifts and analyze past performance to set a strong pricing strategy for your property.
Create your Account NowThe Data: Performance Disparity in SEA
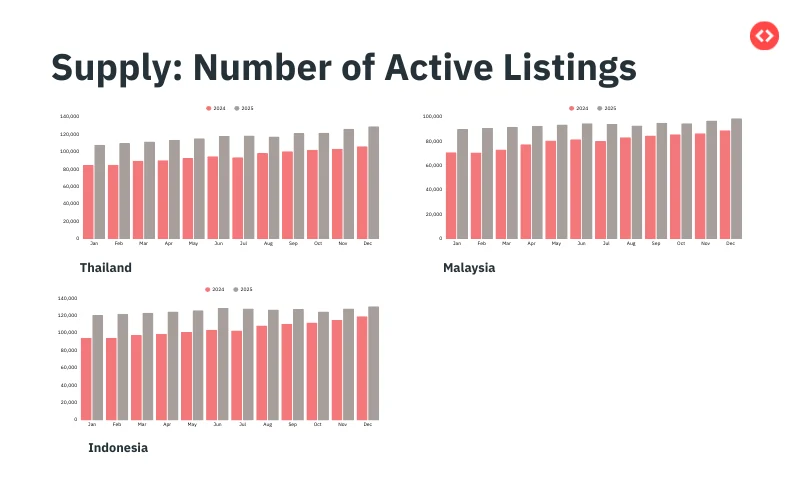
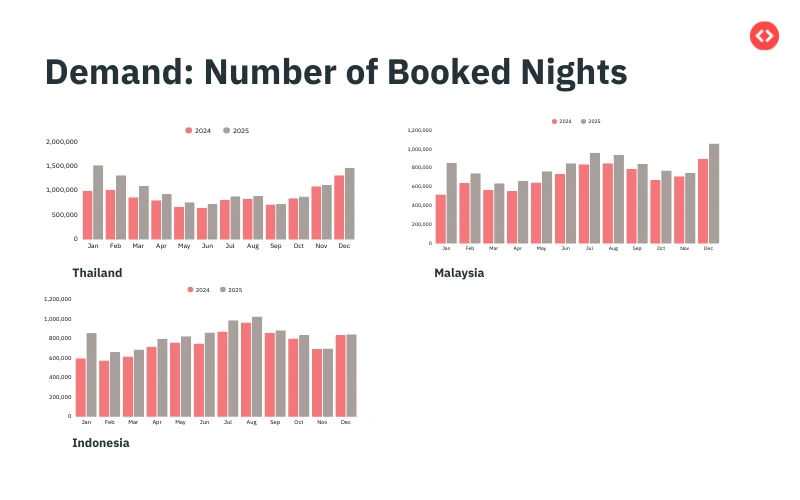
To understand the revenue gap, we must first look at the uneven demand realities across the major SEA markets. While the number of active listings (supply) has trended upward for 2025 compared to 2024 across Thailand, Indonesia, and Malaysia, the revenue outcomes are not uniform.
RevPAR and Occupancy Breakdown
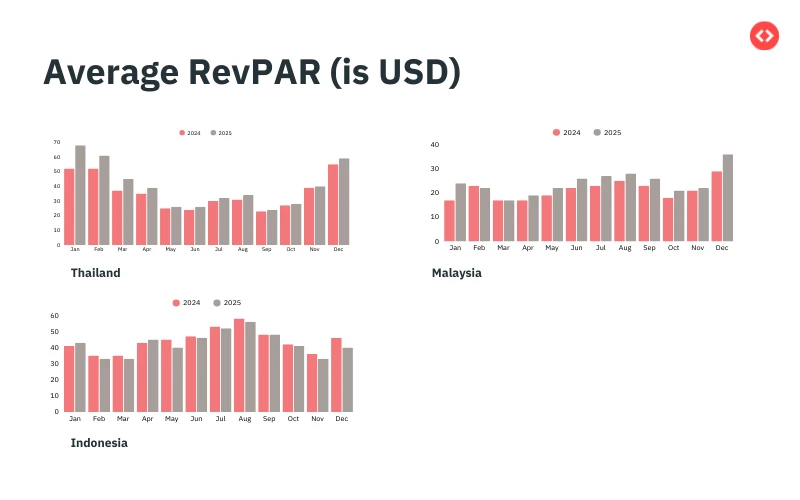
When we analyze Average RevPAR (USD), the differences in market maturity and pricing strategy become clear:
- Thailand: RevPAR shows strong seasonality, peaking significantly in January and December. However, over 50.2% of properties show ‘None’ for sophisticated revenue management profiles.
- Malaysia: Shows a steady demand curve, yet 53.2% of properties fall into the ‘None’ category for revenue intelligence adoption.
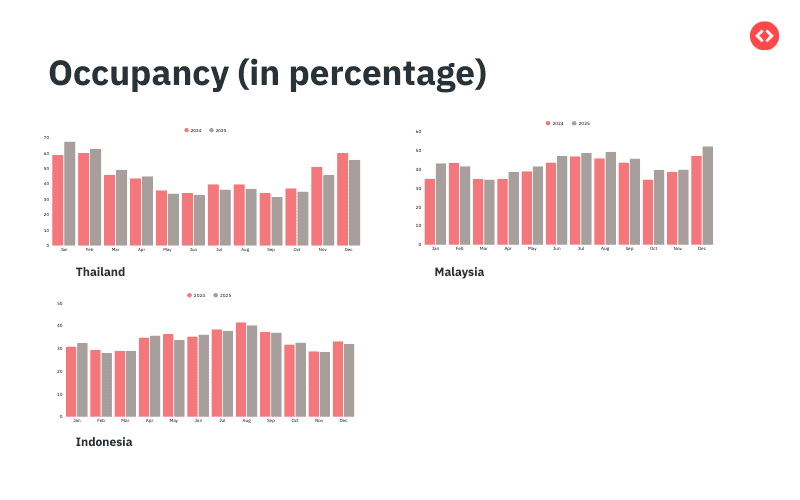
- Indonesia: Despite strong occupancy peaks, particularly in the middle of the year and December, a staggering 63.8% of properties are not utilizing dynamic revenue tools.
The data suggests that most hosts are still treating revenue as a setting rather than a system. This leads to five critical blockers that limit growth.
Dynamically Price Your Property and Get FREE Custom Reports Tailored To Your Property!
Use PriceLabs Dynamic Pricing to competitively and dynamically price your property according to demand shifts and analyze past performance to set a strong pricing strategy for your property.
Create your Account NowThe 5 Blockers Limiting Your Revenue Growth
To scale effectively, you must understand the common operational hurdles that deter potential guests.
1. Static Pricing in Dynamic Markets
Updating your prices is not the same as changing your strategy. Many hosts apply the same logic week after week, treating market volatility as a risk to be avoided rather than an opportunity to be captured. In a dynamic market, a price that worked last Tuesday may be obsolete by Friday.
2. Uniform Length-of-Stay (LOS) Rules
LOS is often treated as an operational convenience (e.g., I only want 3-night bookings to save on cleaning) rather than a strategic lever. Using the same LOS rules across different seasons, weekdays versus weekends, or different markets acts as a hidden gatekeeper that blocks demand.
3. One Strategy Across Uneven Demand
Scale exposes assumptions. Many operators apply the same level of aggressiveness or risk tolerance to their entire portfolio, regardless of the unique booking curves of different properties. If your response to a 30-day booking window is the same as your response to a 2-day window, you are losing money.
4. Late Reaction to Demand Signals
By the time you see your occupancy levels rising, the highest-revenue opportunities have likely already passed. Waiting for certainty in fast-moving markets results in lost revenue before it is even noticed. Early signals—like search spikes or competitor price shifts—are often ignored or undervalued.
5. Reporting Without Decisions
Visibility without velocity is useless. Many hosts spend hours reviewing dashboards and acknowledging insights, but they fail to actually make a decision based on that data. If your reporting doesn’t lead to a tangible base price or rule change, it isn’t moving your revenue.
Dynamically Price Your Property and Get FREE Custom Reports Tailored To Your Property!
Use PriceLabs Dynamic Pricing to competitively and dynamically price your property according to demand shifts and analyze past performance to set a strong pricing strategy for your property.
Create your Account NowWhat Top SEA Operators Do Differently
The top-performing operators in Southeast Asia have moved beyond simple spreadsheets. They treat revenue intelligence as a continuous loop: Signals → Decisions → Automation → Review.
- Trust Fewer, Higher-Quality Signals: They focus on pace, Length-of-Stay, and price positioning rather than getting lost in the noise.
- Aggressive Adaptability: They adapt their LOS rules as aggressively as their pricing to ensure they never block a profitable booking.
- Behavioral Segmentation: They segment their portfolios by guest behavior and booking patterns, not just by geography.
- Automation at Scale: They use tools to apply these decisions instantly across hundreds of dates, ensuring they are always the first to react to market shifts.
Conclusion: Don’t Let the Gap Grow
The paradox of the Southeast Asian market is that, while demand is high, the revenue gap remains wide due to outdated manual strategies. With over half the market still using static pricing, the opportunity to outpace your competition has never been better.
Frequently Asked Questions
What is the “Southeast Asia Paradox” in revenue management?
The Southeast Asia Paradox refers to a recurring regional pattern where revenue performance fails to track actual travel demand. While countries like Thailand, Indonesia, and Malaysia share similar seasonality, major events, and travel behaviors, wide gaps in RevPAR, ADR, and occupancy persist. This divergence occurs because performance is determined by management decisions rather than market signals; when those decisions diverge from demand reality, revenue potential is lost.
Why is my revenue plateauing even though travel demand is high?
Revenue plateaus often stem from specific “blockers” that prevent hosts from capturing market shifts. Many hosts rely on static pricing, where they update prices but fail to change their underlying strategy to meet market volatility. Additionally, using uniform Length-of-Stay (LOS) rules across all seasons and markets acts as a “hidden gatekeeper” that turns away potential guests. Finally, reacting too late to demand signals—often only after occupancy is already visible—means revenue is lost before the host even notices the opportunity.
How do I know if I have “Room for Growth” in my specific market?
Data across Southeast Asia reveals a massive opportunity for hosts to gain a competitive edge, as more than 50% of properties currently do not utilize dynamic pricing. In Thailand, 50.2% of properties have no professional revenue management profile, while 27.5% are categorized as “Low”. Malaysia sees 53.2% with “None” and 24.1% as “Low”. Indonesia has the highest gap, with 63.8% of properties showing no revenue intelligence adoption. Implementing these tools allows you to capture the revenue your competitors are leaving on the table.
What is the difference between “reporting” and “revenue intelligence”?
Reporting is often “visibility without velocity,” where hosts review dashboards and acknowledge insights but delay or never actually make the necessary decisions. Revenue intelligence, by contrast, is a proactive system where you trust specific signals—such as pace, price position, and booking curves—to trigger immediate actions. It shifts the focus from merely seeing what happened to automating how you respond to what is happening in real-time.
How should I adjust my strategy for different booking behaviors?
Top operators in Southeast Asia treat revenue as a system rather than a static setting. They adapt their Length-of-Stay rules as aggressively as their pricing to ensure they aren’t blocking demand during peak periods or weekdays. Crucially, they segment their portfolios based on guest behavior and booking curves rather than just geography. By applying automation at scale, these hosts can protect revenue during low-demand periods and flex their strategy to maximize gains when demand spikes.