
Table of Contents
Updated : Mar 26, 2026
The short-term rental market has matured significantly. What once worked on instinct — setting a flat nightly rate and hoping for bookings — no longer cuts it in an increasingly competitive landscape. Today, the hosts and property managers who consistently outperform their markets share one thing in common: they make decisions backed by data.
STR analytics isn’t a tool reserved for enterprise property managers with dozens of listings. Whether you’re running your first Airbnb or managing a portfolio of vacation rentals, understanding your market data can mean the difference between a property that breaks even and one that generates consistent, scalable revenue.
This guide is designed for everyone — from the first-time host trying to understand what occupancy rate even means, to the seasoned investor evaluating whether to enter a new market. We’ll start with the fundamentals and progressively build toward the strategies that separate good STR operators from great ones.
What Is Short-Term Rental Analytics?
Short-term rental analytics is the practice of collecting, interpreting, and acting on performance data related to vacation rental properties — both your own listings and the broader market you operate in.
Unlike traditional real estate data, which moves slowly (think annual appreciation rates or quarterly vacancy reports), STR data is dynamic. Pricing can shift day by day. Occupancy trends change with local events, platform algorithm updates, or a surge in new supply. That velocity is both what makes STR analytics challenging and what makes it so powerful when used correctly.
STR analytics sits at the intersection of two data streams:
- Your own listing data: occupancy, revenue, guest reviews, booking patterns.
- Market-level data: what competitors are charging, how local demand is trending, and what supply looks like in your area.
Tools like PriceLabs are built to bring both streams together — giving you a real-time view of your performance relative to the market, and then using that data to automatically optimize your pricing.
Dynamically Price Your Property and Get FREE Custom Reports Tailored To Your Property!
Use PriceLabs Dynamic Pricing to competitively and dynamically price your property according to demand shifts and analyze past performance to set a strong pricing strategy for your property.
Create your Account NowWhy STR Market Data Matters More Than Ever
STR platforms like Airbnb and Vrbo have made it easier than ever to list a property, intensifying competition in nearly every market. In high-demand cities, a single neighbourhood might have hundreds of comparable listings competing for the same guest.
In this environment, data is your competitive advantage. Here’s why:
- Top-performing listings price dynamically. They don’t rely on a single rate year-round. They adjust based on demand signals, local events, and competitor behavior.
- Ignoring market data costs real money. Overpricing leads to vacant nights. Underpricing leaves revenue on the table — often without the host even realizing it.
- Gut instinct doesn’t scale. What worked for your first property won’t necessarily work for your fifth, or in a different market.
Consider two hosts in the same city. Host A sets a flat $150/night rate year-round. Host B uses market data to identify that demand spikes during a local festival weekend and adjusts their rate to $280/night — while dropping to $110/night during a historically slow stretch to maintain occupancy. Over 12 months, the difference in revenue is substantial — not because of anything about the property itself, but because of how each host uses information.
Core STR Metrics Every Host Must Know
Before you can optimize your performance, you need to understand what you’re measuring. These are the seven metrics that form the foundation of any serious STR analytics practice.
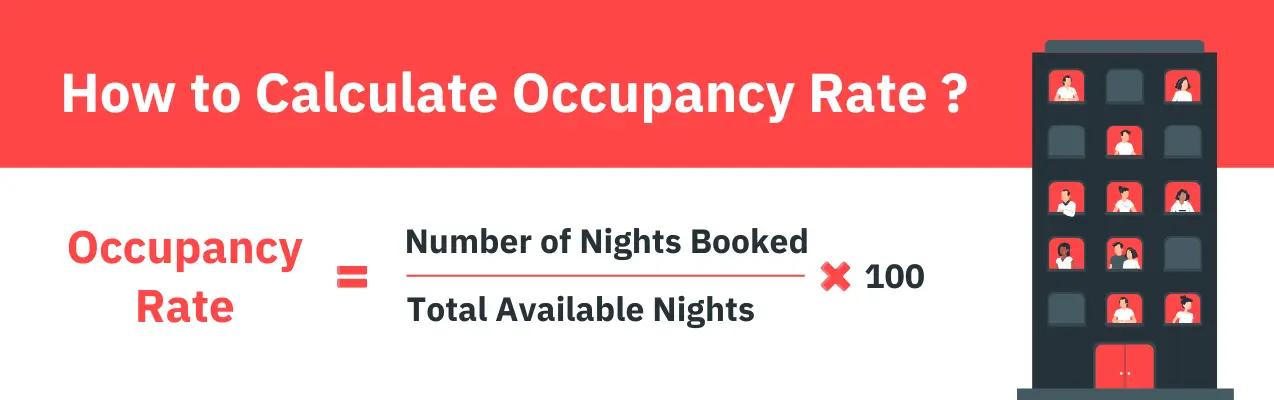
1. Occupancy Rate
Occupancy rate is the percentage of available nights that are booked over a given period.
Formula: (Booked Nights ÷ Available Nights) × 100
A 70% occupancy rate is often cited as a healthy benchmark, but this varies significantly by market. A beach town might see 90%+ in summer and 30% in winter. What matters is how your occupancy compares to your local market average — not an abstract industry number.
Note the distinction between occupancy rate and booking rate: occupancy measures nights filled, while booking rate measures how often your listing converts views into reservations. Both matter, but for different reasons.
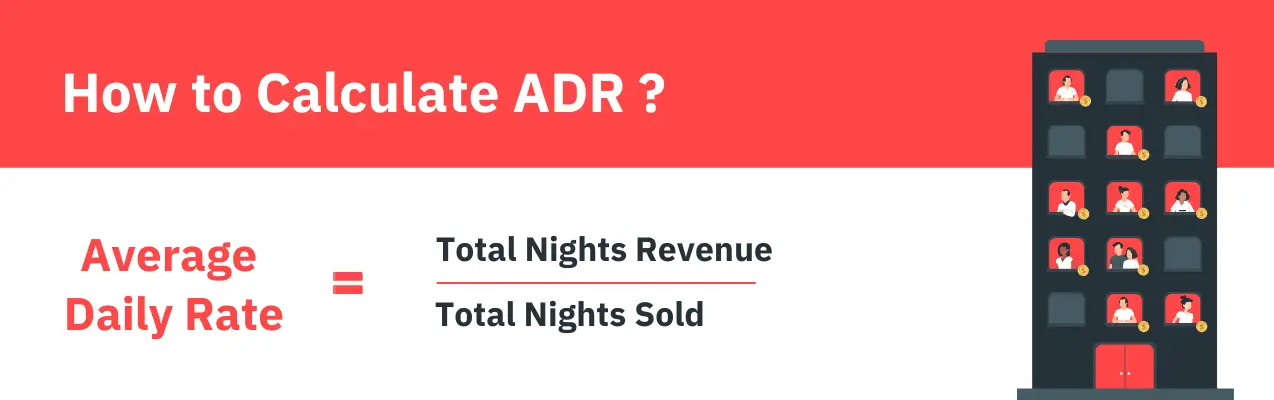
2. Average Daily Rate (ADR)
ADR is the average revenue earned per booked night, calculated by dividing total room revenue by the number of booked nights.
Setting a competitive ADR requires understanding what comparable listings in your market are charging — not just what feels right. PriceLabs’ Market Dashboard gives you a real-time view of ADR trends in your area, broken down by property type and bedroom count, so you can position your pricing accordingly.
Common beginner mistake: setting ADR based on a neighbouring listing without understanding whether that listing is actually performing well.
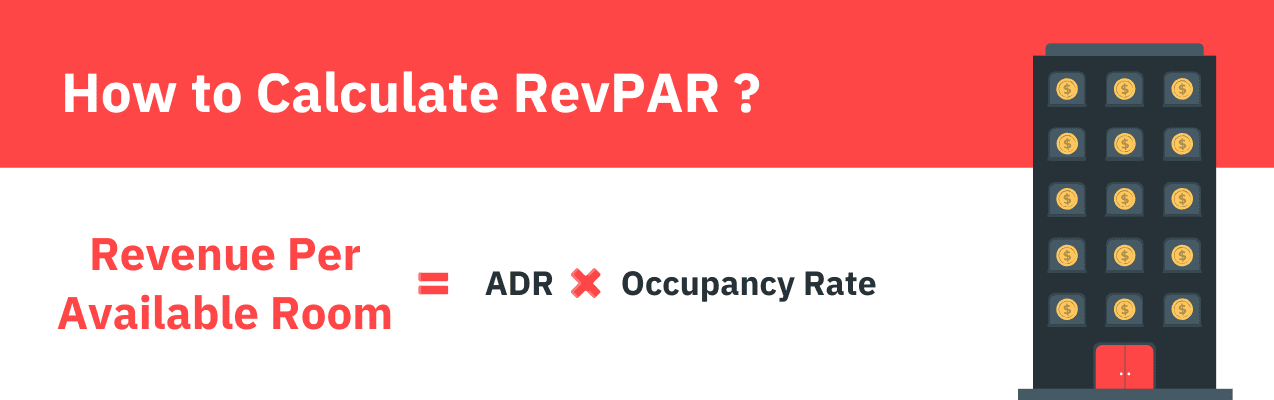
3. RevPAR (Revenue Per Available Room)
RevPAR is arguably the most important single metric for evaluating STR performance because it accounts for both your pricing and your occupancy.
Formula: ADR × Occupancy Rate (or Total Revenue ÷ Available Nights)
Two listings with the same ADR can have dramatically different RevPAR if one has 80% occupancy and the other has 50%. RevPAR is your true revenue efficiency metric — and it’s the best way to benchmark your property against the market.
4. Booking Lead Time
Lead time is the number of days between when a booking is made and when the guest checks in. Short lead times (0–7 days) suggest last-minute demand; long lead times (60+ days) suggest high-confidence demand or popular event weekends.

Understanding your lead time distribution helps you decide when to hold firm on price and when to discount to fill gaps. If you’re consistently seeing bookings come in 2–3 days before arrival, that’s a signal your pricing may be too high for your market.
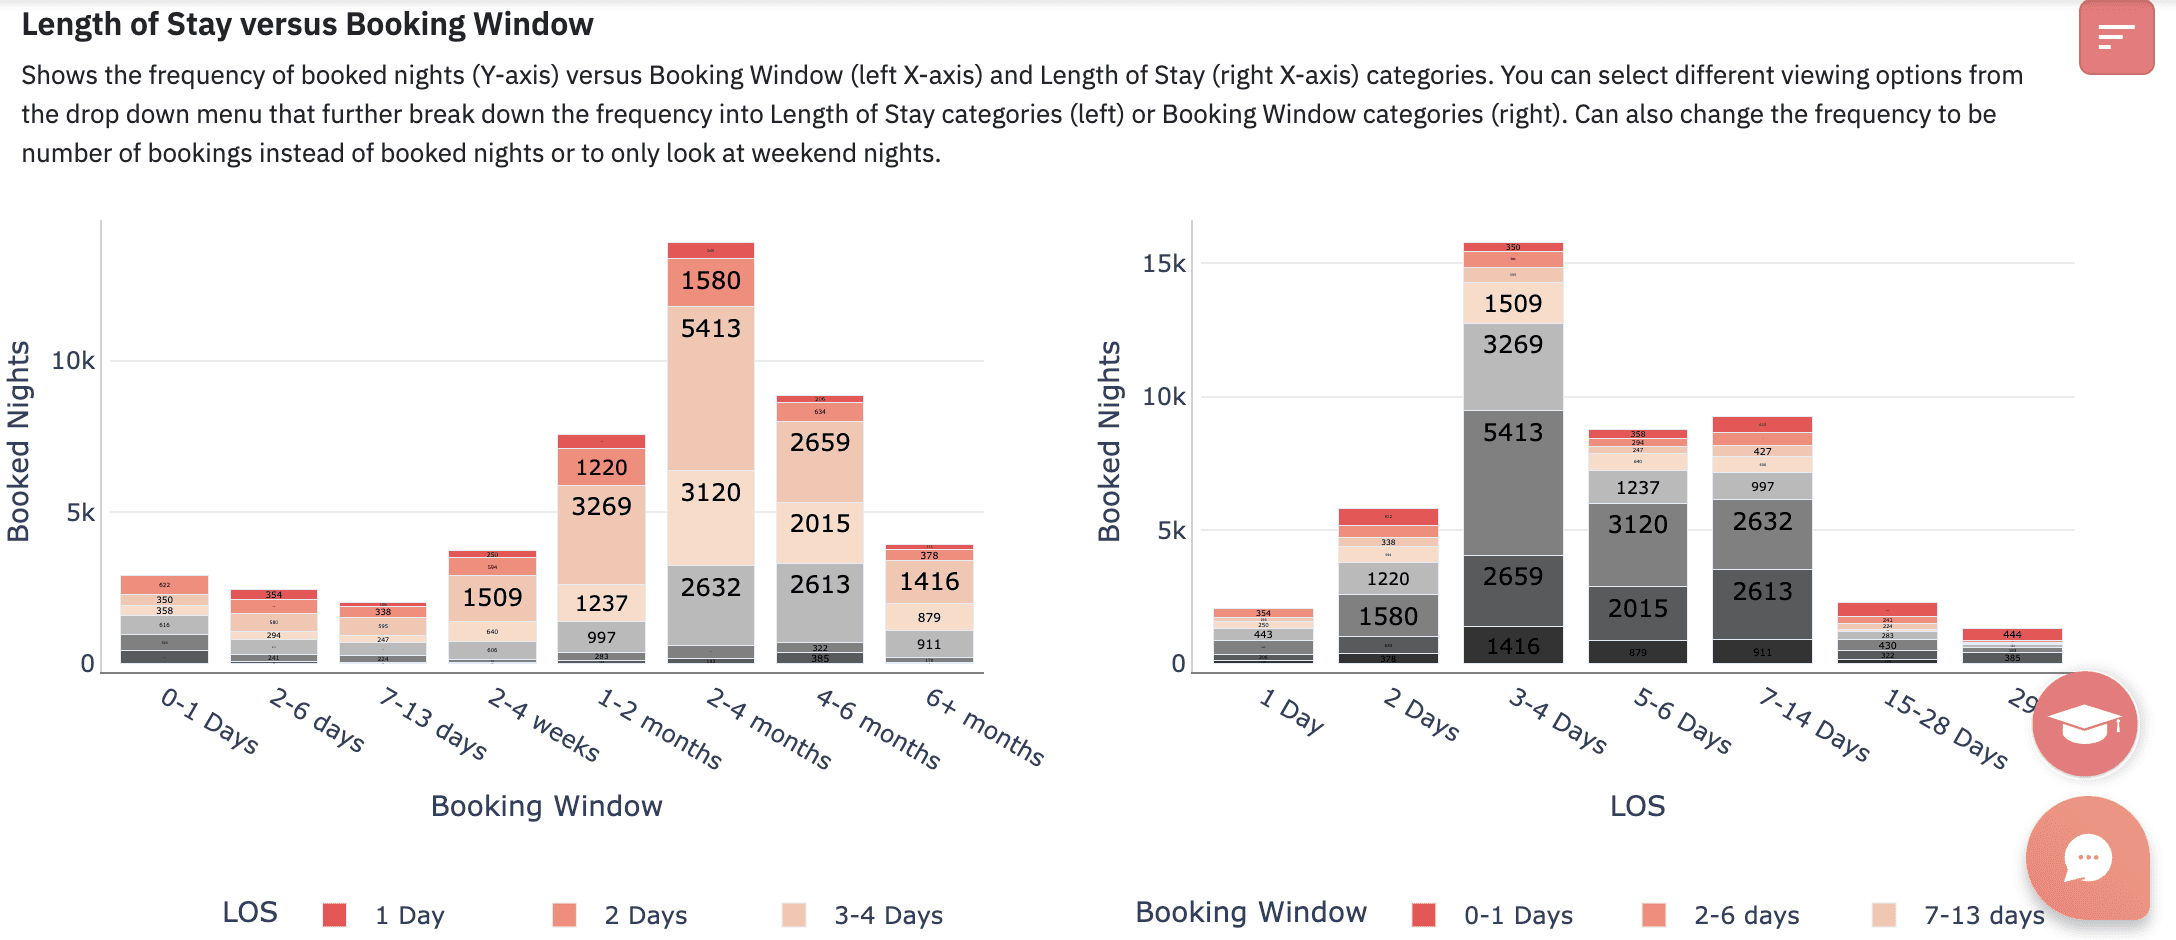
5. Length of Stay (LOS)
LOS data tells you how long guests typically stay. This matters because minimum-stay settings directly impact both occupancy and ADR, and getting the balance wrong is a common revenue leak.
6. Guest Satisfaction & Review Scores
Your review score is not just feedback; it’s a data point with direct business impact. Platform algorithms on Airbnb and Vrbo weigh review scores heavily in search ranking. A drop from 4.9 to 4.7 stars can meaningfully reduce your listing’s visibility.
Track your scores over time and look for patterns. If guests consistently mention parking or check-in as pain points, that’s actionable data — not just commentary.
7. Revenue & Gross Booking Value
Gross booking value (GBV) is the total amount guests pay — including cleaning fees and service charges. Your net revenue is what remains after platform fees, taxes, and operating expenses.
Beginners often track GBV and mistake it for profit. Make sure your analytics routine includes a clear view of net revenue so you’re evaluating real performance, not inflated numbers.
Dynamically Price Your Property and Get FREE Custom Reports Tailored To Your Property!
Use PriceLabs Dynamic Pricing to competitively and dynamically price your property according to demand shifts and analyze past performance to set a strong pricing strategy for your property.
Create your Account NowUnderstanding STR Market Data
1. Supply & Demand in Your Market
Supply refers to the number of active listings competing in your market. Demand refers to the volume of travellers who search for and book accommodations. The relationship between the two determines how much pricing power you have.
If supply is growing faster than demand in your market, expect downward pressure on both occupancy and ADR. Conversely, supply constraints in a high-demand market signal pricing opportunity. PriceLabs’ Market Dashboard tracks both supply growth and demand trends, giving you an early warning system for market shifts.
2. Seasonality & Trend Analysis
Every STR market has a seasonality pattern — periods of peak demand, shoulder seasons, and slow periods. Understanding yours is non-negotiable.
Build a seasonality calendar for your property that maps historical occupancy and ADR data month by month. Layer in local events — festivals, conferences, sporting events — that create demand spikes outside the typical pattern. This calendar becomes the backbone of your annual pricing strategy.
3. Competitor Benchmarking
Identifying your true competitors means looking beyond proximity. Your real comps are listings that match your property type, bedroom count, amenity set, and quality tier; not just the nearest listing on the map.
When benchmarking, look at: pricing patterns across the calendar, occupancy levels (inferred from availability calendars), review scores, and amenity offerings. The goal isn’t to match your competitors, it’s to understand where you can differentiate and where you need to stay competitive.
4. Neighbourhood-Level vs City-Level Data
City-level data is a starting point, not a destination. A city’s average occupancy rate of 68% might mask the fact that one neighbourhood performs at 82% while another sits at 51%. Location drives performance in ways that aggregate data obscures.
Whenever possible, drill down to neighbourhood-level or zip-code-level data. PriceLabs allows you to define custom market comparisons so your benchmarks reflect your actual competitive set rather than a broad city average.
STR Analytics Tools — A Practical Breakdown
The STR analytics tool landscape has grown significantly. Different tools serve different purposes — understanding what each does well prevents you from paying for overlap or missing critical functionality.
PriceLabs: Revenue Management & Market Intelligence
PriceLabs is the most comprehensive revenue management platform for STR operators, and the one tool that serves hosts at every stage — from a single first listing to a professional portfolio of fifty properties. What distinguishes it from standalone analytics tools is the combination of dynamic pricing automation and deep market intelligence in a single platform.
The dynamic pricing engine works by analysing your property’s historical performance, local supply and demand patterns, seasonal trends, competitor behaviour, and real-time demand signals — then recommending a nightly rate for every day on your calendar. You set your base price and define minimum and maximum rate thresholds; PriceLabs continuously optimises within that range.
The Market Dashboard is PriceLabs’ market intelligence layer, and it’s worth understanding in detail. It surfaces:
- Real-time occupancy trends, ADR patterns, and supply growth — filterable by property type, bedroom count, and custom geographic area
- Forward-looking pace data showing how quickly bookings are accumulating for future dates relative to historical norms
- Competitor rate movement, so you can see when and how much comparable listings are adjusting their prices
- Demand signals from upcoming local events that may not yet be reflected in booking activity
For a host trying to understand why occupancy dropped last month — or an investor evaluating a new market — the Market Dashboard provides the context that raw booking data alone can’t. This guide to PriceLabs’ metrics and graphs walks through the logic behind specific recommendations and how to interpret the platform’s outputs.
For portfolio operators, PriceLabs adds a consolidated analytics layer across all listings — revenue, occupancy, ADR, RevPAR — enabling comparisons between properties and their respective local markets.
Dynamically Price Your Property and Get FREE Custom Reports Tailored To Your Property!
Use PriceLabs Dynamic Pricing to competitively and dynamically price your property according to demand shifts and analyze past performance to set a strong pricing strategy for your property.
Create your Account NowBest for: Pricing optimisation, market intelligence, and portfolio management at any scale — from a first-time host to a professional property manager.
AirDNA
AirDNA is primarily a market research tool, offering historical and forward-looking data across thousands of STR markets globally. Its strength is breadth — useful for evaluating new markets or comparing performance across cities. Its limitations are in depth: neighbourhood-level precision and property-specific benchmarking are areas where more specialised tools perform better.
Best for: Pre-entry market research and macro-level market comparison.
Rabbu & Mashvisor
Both tools are oriented toward property investors in the underwriting phase — evaluating potential acquisitions and projecting revenue before purchase. They provide estimated revenue ranges based on market data and comparable listings, which is useful for building a financial model but less useful for ongoing operational management.
Best for: Investment underwriting and property acquisition analysis.
Platform-Native Analytics
Airbnb’s host dashboard and Vrbo’s analytics tools provide visibility into your own listing’s performance — views, bookings, earnings — but they are intentionally limited. What they don’t show you:
- Competitor data or market-level occupancy trends
- Forward-looking demand signals or pace data
- How does your performance compare to similar listings in your area
Platform analytics are a starting point for understanding your own listing. They are not a strategy. Any host making pricing decisions based solely on platform data is operating with a significant information disadvantage.
Free vs. Paid Tools
Free tools can provide orientation when you’re getting started. They fall short on real-time accuracy, neighborhood-level precision, and the forward-looking data that makes a material difference to pricing decisions.
For most hosts, the question isn’t whether a paid tool is worth it — it’s when to make the transition. If a dynamic pricing tool recovers even two additional booked nights per month that would otherwise go vacant, or captures an extra $30 per night during a high-demand period you didn’t identify manually, the tool cost is covered many times over. PriceLabs is the recommended starting point because it combines pricing automation and market intelligence in a single platform — rather than requiring separate subscriptions to cover both.
Using Data to Optimize Your STR Performance
1. Building a Pricing Strategy with Data
Static pricing — one rate year-round — is the single most common revenue mistake STR hosts make. Dynamic pricing, by contrast, adjusts your nightly rate based on real-time demand signals, seasonality, local events, and your own booking patterns.
Here’s a simple framework for getting started:
- Set a base price using your market’s median ADR for comparable properties.
- Define minimum and maximum price thresholds — your floor protects against desperate discounting; your ceiling captures peak demand.
- Enable dynamic pricing (via PriceLabs) to automate adjustments within your defined range.
- Layer in manual adjustments for major local events you know will drive outsized demand.
2. Improving Occupancy with Data
If your occupancy is below market average, data will tell you why. Common root causes include: pricing too high for your market tier, minimum-stay requirements that create unbookable gaps, or a listing-quality issue reflected in below-average review scores.
Use booking lead time data to diagnose the problem. If you’re not seeing bookings until 3–5 days out, your pricing is likely creating resistance. A modest rate reduction 10–14 days before arrival — automated through PriceLabs — can convert those hesitant browsers into confirmed guests.
3. Reducing Gaps Between Bookings
Gap nights — isolated 1 or 2-night gaps between bookings — are a silent revenue killer. They’re often too short to book under standard minimum stay settings and too long to leave unfilled comfortably.
The solution is gap-aware minimum-stay rules: automatically reducing your minimum stay during these gap periods to make them bookable, often at a slightly adjusted rate. PriceLabs handles this automatically, analysing your calendar and dynamically adjusting minimum stays so gap nights are filled rather than wasted.
4. Improving Guest Experience Using Data
Review scores are a trailing indicator of guest experience, but patterns in your review data can surface recurring issues before they compound. If three consecutive guests mention slow Wi-Fi or unclear parking instructions, that’s a data signal worth acting on.
Treat your review scores as a quarterly KPI. A sustained drop — even from 4.9 to 4.7 — warrants investigation. Platform algorithms respond quickly to declining scores, and recovering lost search visibility is significantly harder than maintaining it.
5. Reporting Performance Over Time
A simple monthly performance report should track: Occupancy Rate, ADR, RevPAR, Gross Booking Value, and Net Revenue. Compare month-over-month and year-over-year to separate your own performance trends from broader market movements.
PriceLabs’ Portfolio Analytics dashboard makes this straightforward for multi-property operators, providing a consolidated view of performance across all listings in one place.
Dynamically Price Your Property and Get FREE Custom Reports Tailored To Your Property!
Use PriceLabs Dynamic Pricing to competitively and dynamically price your property according to demand shifts and analyze past performance to set a strong pricing strategy for your property.
Create your Account NowUsing Market Data for Bigger STR Decisions
1. Evaluating a New Market Before Entering
Before listing in a new market — or purchasing a property to STR — data should answer five questions:
- What is the market’s average occupancy rate and ADR for comparable properties?
- Is supply growing faster or slower than demand?
- What does seasonality look like — is there a sustainable year-round demand base or heavy seasonal concentration?
- Are there regulatory headwinds (permit caps, licensing requirements, pending legislation) that could constrain supply or impose new costs?
- What does the competitive landscape look like — is the market saturated with professional operators, or is there room for a well-positioned new listing?
2. Deciding Whether to Add a New Property
Use RevPAR and market occupancy data to build a revenue projection for any property you’re considering. A conservative projection uses the bottom quartile of market occupancy and ADR; an optimistic one uses the median. Build your financial model around the conservative case.
3. Knowing When to Exit a Market
Markets change. Regulation, new supply, or sustained demand decline can erode performance that once looked strong. Data signals that warrant serious attention include: 3+ consecutive months of declining RevPAR, occupancy falling more than 10 points below market average, or regulatory changes that materially increase operating costs or restrict operations.
4. Adjusting Your Listing Strategy Based on Data
Data should inform more than just pricing. If your LOS data shows guests consistently staying 5–7 nights, a 2-night minimum is leaving money on the table (and potentially attracting guests who generate more wear and turnover costs). If competitor analysis shows that listings with hot tubs in your market command a 30% ADR premium, that’s a capital investment worth modeling.
STR Regulations & How They Affect Market Data
Regulations are a critical and often underappreciated data point in STR analytics. Permit caps, licensing requirements, primary residence restrictions, and outright bans have materially affected supply — and therefore performance — in markets from New York City to Barcelona.
When evaluating any market, include regulatory risk in your analysis. Resources like STR advocacy groups, local government planning departments, and tools that track regulatory changes by city are worth monitoring regularly. A strong-performing market today can look very different 18 months from now if significant regulatory changes are in the pipeline.
Common Beginner Mistakes When Using STR Data
- Tracking too many metrics at once. Start with Occupancy Rate, ADR, and RevPAR. Master those before expanding your dashboard.
- Comparing to the wrong competitors. Your comps should match your property type, bedroom count, and quality tier — not just your zip code.
- Relying solely on platform analytics. Airbnb and Vrbo dashboards show you your own data only. Without market context, you’re optimizing in the dark.
- Ignoring seasonality. Treating every month the same is one of the most common and costly STR pricing mistakes.
- Making decisions from a single data point. One bad month doesn’t define a trend. One competitor’s rate doesn’t define your market. Look for patterns.
- Confusing gross revenue with net profit. Platform fees, cleaning costs, and taxes can meaningfully reduce what looks like strong top-line revenue.
- Not reviewing data consistently. A weekly check on occupancy and lead time data, and a monthly review of overall performance, should be non-negotiable in your routine.
Building Your First STR Analytics Routine
Consistency matters more than complexity when you’re starting out. Here’s a five-step framework to get your analytics practice off the ground:
- Set up your tracking system. Start with a simple spreadsheet — or connect PriceLabs to your listing for automated tracking from day one.
- Choose your three core metrics. Occupancy Rate, ADR, and RevPAR. Nothing else until these feel second nature.
- Set a review cadence. Weekly for occupancy and lead time; monthly for revenue and performance summary.
- Benchmark against your market quarterly. Use PriceLabs’ Market Dashboard to compare your performance against comparable listings in your area.
- Make one data-driven change at a time. Adjust your minimum stay, your base price, or your seasonal strategy — then measure the impact before changing something else.
Frequently Asked Questions
1. What is the most important STR metric for beginners?
Start with RevPAR. It combines both your pricing and your occupancy into a single number, giving you a true picture of how efficiently your property is generating revenue. Once you understand RevPAR, ADR and occupancy become easier to interpret in context.
2. How do I know if my occupancy rate is good?
Good occupancy is relative to your market. A 65% annual occupancy rate might be excellent in a highly seasonal beach market and underperforming in a year-round urban market. Always benchmark against comparable listings in your specific area using a tool like PriceLabs’ Market Dashboard.
3. Do I need a paid analytics tool to get started?
You can start with free tools and platform-native analytics to get oriented. But once you’re earning meaningful revenue, a paid tool — particularly one that combines dynamic pricing with market intelligence, like PriceLabs — typically pays for itself many times over in recovered revenue.
4. How often should I review my STR data?
Weekly for operational metrics (occupancy, lead time, upcoming booking pace) and monthly for performance summaries (revenue, ADR, RevPAR vs. prior month and prior year). Quarterly, benchmark your performance against your market.
5. What’s the difference between ADR and RevPAR?
ADR measures your average rate per booked night. RevPAR measures revenue per available night — whether booked or not. A listing with a high ADR but low occupancy will have a lower RevPAR than one with a slightly lower ADR but consistently high occupancy. RevPAR is the more meaningful metric.
6. How do I find market data for my specific neighborhood?
City-level data is available through tools like AirDNA and PriceLabs. For neighborhood-level precision, PriceLabs allows you to define a custom comparison set of listings that match your property’s specific characteristics and location, giving you a much more accurate benchmark than city-wide averages.
7. Can I use STR analytics for a single property?
Absolutely. In fact, single-property hosts often have the most to gain from analytics — because every booking decision has a proportionally larger impact on total revenue. PriceLabs is used by hosts with one listing and operators with hundreds.
8. How do regulations affect my market data?
Regulations directly affect supply. When a city introduces permit caps or licensing requirements, the number of active listings typically drops — which can create favorable conditions for compliant operators who remain. Tracking regulatory changes in your market is an important part of a complete analytics practice.
Conclusion: Data Turns Reactive Management Into Proactive Strategy
The gap between average STR performance and top-quartile performance rarely comes down to property quality alone. It comes down to information — and what hosts and investors do with it.
The metrics covered in this guide — occupancy rate, ADR, RevPAR, lead time, length of stay, and review scores — are the foundation. Layer in market-level supply and demand data, competitor benchmarking, and seasonality analysis, and you have everything you need to make decisions with confidence rather than guesswork.
The right approach is to start simple: pick one metric, track it consistently this week, and build from there. You don’t need to master every tool or track every data point simultaneously. What matters is developing the habit of letting data inform your decisions — and then measuring whether those decisions are working.