
Table of Contents
Updated : Jan 29, 2026
In the hyper-competitive vacation rental market, “setting it and forgetting it” is a recipe for stagnant revenue. Success isn’t just about having a great property; it’s about systematic hospitality revenue management benchmarking. Without comparing your performance against the broader market, you are essentially flying blind.
Benchmark-driven pricing allows you to transform raw data into a competitive advantage. By leveraging dynamic pricing software, hospitality owners can move beyond gut feelings to precise, data-backed decisions that capture every dollar of potential profit.
PriceLabs: AI-Powered Dynamic Pricing and Benchmarking
To manage these benchmarks effectively across a growing portfolio, manual spreadsheets won’t cut it. PriceLabs offers a market-leading hospitality revenue management benchmarking solution that automates the heavy lifting.
- AI-Driven Analytics: PriceLabs uses advanced algorithms to deliver dynamic price recommendations based on real-time supply and demand data.
- Seamless Property Management System Integration: With connections to over 160 PMS and channel managers, PriceLabs syncs your data instantly, ensuring “harmonized” pricing across Airbnb, Vbro, and direct sites.
- Portfolio Analytics: Gain a bird’s-eye view of your entire inventory. Identify which units are underperforming and apply bulk updates to stay ahead of market shifts.
1. Occupancy Rate: Measuring Property Utilization
Occupancy rate is the percentage of booked nights out of total available nights in a given period. It is your primary “pulse check” for demand.
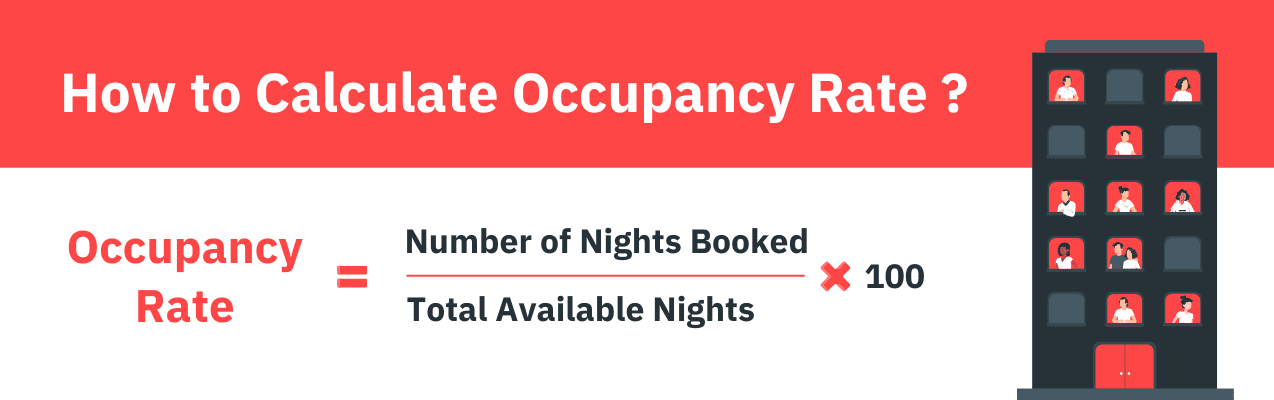
To benchmark effectively, track occupancy on weekly and seasonal levels. If your occupancy is at 95%, you might feel successful, but you are likely underpriced. Conversely, low occupancy suggests a need for better marketing or price adjustments.
| Occupancy Range | Interpretation | Strategy |
| 90–100% | Likely Underpriced | Increase ADR to capture higher margins. |
| 70–85% | Healthy Equilibrium | Maintain current strategy; monitor comp sets. |
| Below 60% | Underperforming | Implement promotional tactics or lower rates. |
2. Average Daily Rate (ADR): Optimizing Revenue per Night
Average Daily Rate (ADR) is the average revenue earned per booked night, calculated as:
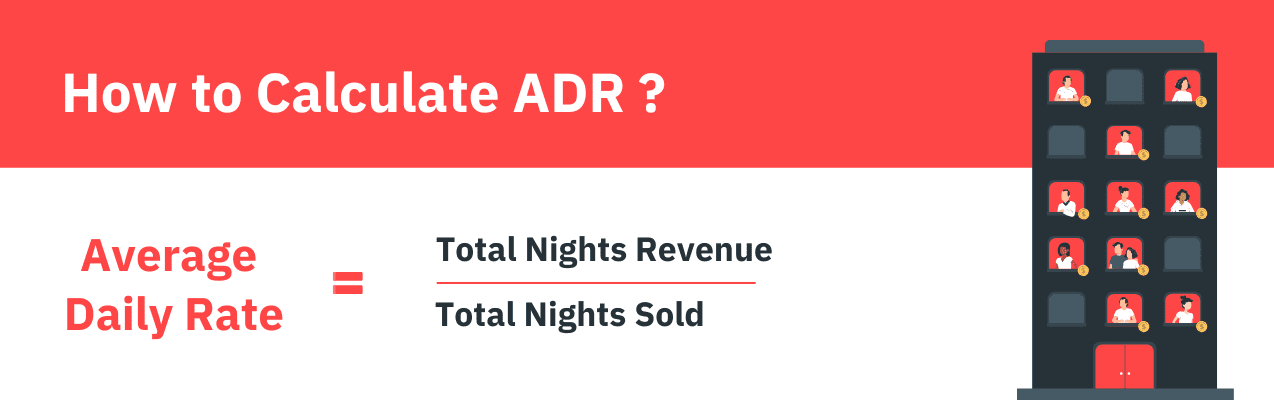
While occupancy tells you if people are staying, ADR tells you what they are willing to pay. Benchmarking ADR against your internal history helps you see if your property value is appreciating. Use portfolio analytics to see whether your 3-bedroom units are keeping pace with local luxury trends.
3. RevPAR: The Holistic View of Efficiency
RevPAR (Revenue per Available Room) is the gold standard of hospitality metrics. It balances occupancy and ADR to show how much revenue every unit is generating, whether it’s occupied or not.
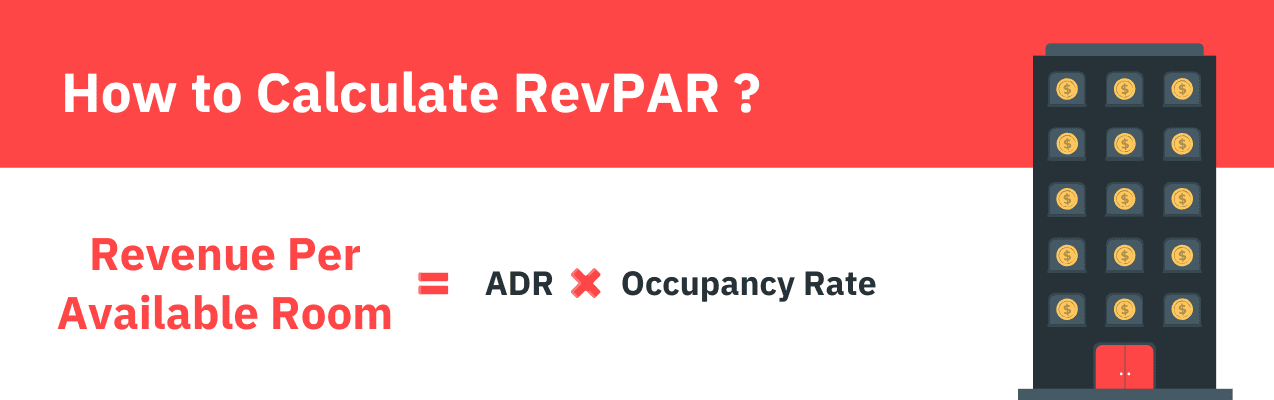
Tracking RevPAR trends in a dashboard allows you to spot “leaky” revenue. A property with 50% occupancy at $400 ADR has the same RevPAR ($200) as one with 100% occupancy at $200 ADR—but the former likely has lower operational (cleaning/wear-and-tear) costs.
4. Booking Lead Time: Understanding Traveler Behavior
Booking lead time is the median number of days between the booking and check-in dates.
- Short Lead Times (0-7 days): Common in urban markets. Use last-minute discounts to fill gaps.
- Long Lead Times (60+ days): Common for seasonal coastal rentals. Set higher rates and dynamic minimum stays to reward early planners.
Monitoring 7, 30, and 90-day rolling averages helps you detect shifts in buyer behavior before they impact your bottom line.
How Does Your Portfolio Compare to the Market?
Get instant access to real-time market data and automated dynamic pricing. See exactly where you stand against your competition with our Portfolio Analytics and Market Dashboard.
Start Your free trial5. Competitive Price Index: Positioning Your Portfolio
A Competitive Price Index compares your median nightly rate to a “comp set”—a group of local listings with similar amenities, size, and guest ratings.
If your index is consistently 1.2 (meaning you are 20% more expensive than the average), you must justify that with superior reviews or amenities. If your index drops while your competitors’ occupancy rises, it’s time to recalibrate your dynamic pricing software.
6. Channel Acquisition Cost (CAC) and ROAS
True profitability requires looking at what you spend to get a guest. This is where Channel Acquisition Cost (CAC) and ROAS come in.
- CAC: The average cost (fees, ads) to acquire a booking. Marketplace CAC averages around $72, while Google Ads CPCs can reach $5.26 (2025 benchmarks).
- ROAS: ROAS (Return on Ad Spend) measures how much gross revenue you earn for every dollar (or pound) spent on advertising.
| Channel | Avg. CAC | ROAS Target |
| Direct Website | Low (SEO/Email) | 10:1+ |
| OTAs (Airbnb/VRBO) | 10–15% Commission | N/A |
| Paid Search | High ($70+ per lead) | 4:1 |
7. Promotion Conversion Lift: Evaluating Discounts
Promotion conversion lift measures the incremental increase in bookings specifically attributed to a discount or “early bird” package.
Avoid “blanket discounting.” Instead, A/B test a “Stay 3, Pay 2” deal versus a flat 15% discount. Track the lift in RevPAR to ensure the promotion isn’t just “cannibalizing” guests who would have paid full price anyway.
Frequently Asked Questions
How can hospitality owners benchmark their pricing performance against similar properties?
Owners should define a “comp set” of 5–10 properties with similar features and use a tool like PriceLabs to track their median rates and occupancy in real-time.
What is the occupancy rate, and why is it important to benchmark?
Occupancy rate tracks the percentage of available nights booked. Benchmarking helps owners spot under or over pricing and adjust pricing strategies to optimize utilization.
How do I calculate and use Average Daily Rate effectively?
Divide total nightly revenue by the number of nights booked. Use this to ensure your “per-night” value stays competitive as demand fluctuates.
Why should I track RevPAR instead of just occupancy or ADR?
RevPAR prevents “vanity metrics.” It ensures you aren’t sacrificing too much price for occupancy, or too much occupancy for a high price.
How can understanding booking lead time improve my pricing strategy?
If guests are booking further in advance than usual, it’s a signal of high demand—allowing you to raise rates for the remaining dates.