
Table of Contents
Updated : Apr 2, 2026
Choosing the right vacation rental pricing tool isn’t about finding the flashiest interface; it’s about establishing a clear, metric-driven framework that actually moves the needle. To truly compare performance across occupancy, ADR, and RevPAR, you need to define your targets, ensure your data is spotless, run controlled experiments, and measure your results against the right market benchmarks.
This guide breaks down the essentialvacation rental metrics, provides the formulas you need to master them, and offers an eight-step validation process to ensure your pricing software delivers real-world impact. For revenue leaders, this is how you connect algorithmic suggestions to measurable business growth.
Bonus Read: The Ultimate Guide to Dynamic Pricing for Short-Term Rentals
Understanding Core Revenue Metrics for Vacation Rentals
At its heart, successful revenue management relies on three pillars: Average Daily Rate (ADR), Occupancy Rate, and Revenue per Available Room (RevPAR). These KPIs allow you to quantify your pricing performance, identify necessary trade-offs, and benchmark your tools consistently across different properties and seasons. While these formulas mirror hotel industry standards, they are tailored here to fit the unique availability patterns of the vacation rental market.
What is ADR and How to Calculate It?
Average Daily Rate (ADR) measures the average income generated per booked night over a specific timeframe. It’s a pure look at your pricing power, stripped of the “noise” created by occupancy fluctuations.
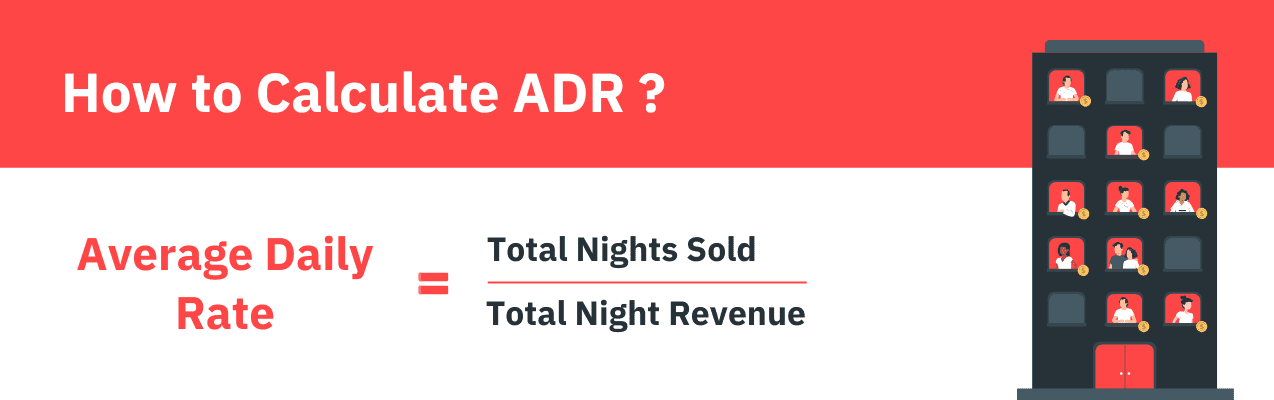
Example: If your property earned $12,000 from 80 sold nights, your ADR is $150.
Optimizing your ADR is about maximizing income potential without necessarily booking every single night. Modern dynamic pricing tools, like PriceLabs, constantly adjust these nightly rates based on real-time demand, seasonality, and competitor moves to ensure your ADR stays responsive to the market.
Master Your Market Strategy
Validating a pricing tool is just the first step. To stay ahead in 2026, you need a partner that turns complex data into clear outcomes. Book a Revenue Strategy Consultation with our team to see how PriceLabs fits into your unique 8-step validation process.
Start Your free trialDefining Occupancy and Its Importance
Occupancy Rate represents the percentage of your available nights that are actually booked. It serves as an early warning system for shifts in demand and a vital lever for maintaining steady cash flow.
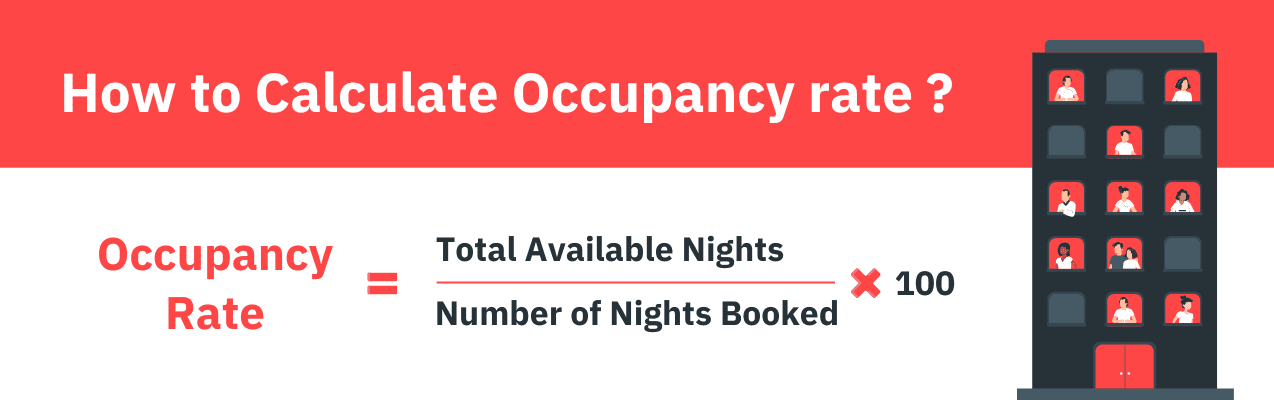
Example: If you have 72 booked nights out of 90 available, your occupancy is 80%.
Dynamic pricing engines typically boost occupancy by lowering rates during lulls or filling “orphan nights” with targeted discounts. Strategy should shift with the calendar:
- Peak Season: Focus on protecting a high ADR; don’t sell out too early and leave money on the table.
- Shoulder Season: Use length-of-stay (LOS) strategies to build a healthy booking base.
- Low Season: Be aggressive. Use last-minute discounts and flexible minimum stays to capture whatever demand exists.
What is RevPAR and How It Combines ADR and Occupancy
RevPAR (Revenue per Available Rental) is the gold standard of metrics. It measures total revenue per available night, capturing the combined effectiveness of your pricing and booking volume. It is the cleanest way to compare one pricing tool against another.
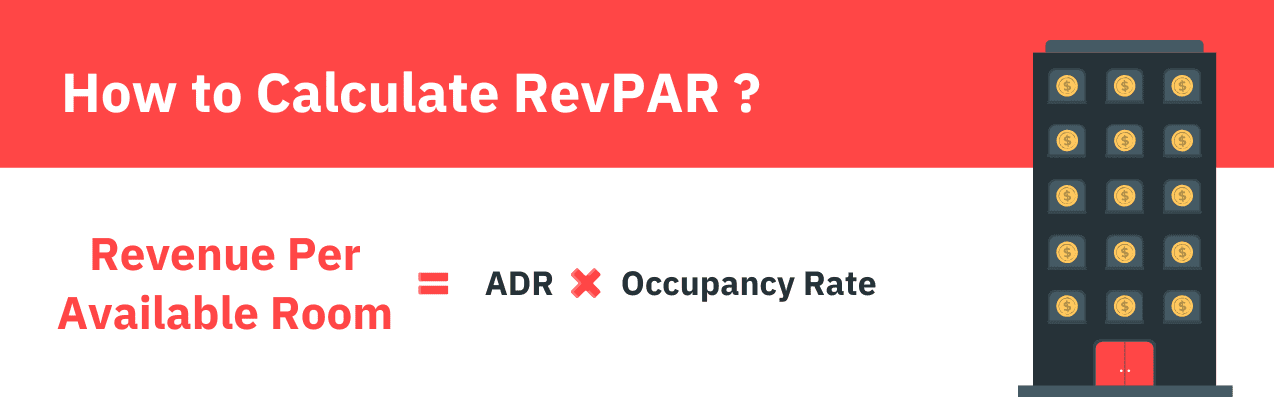
Example: If your ADR is $150 and your occupancy is 80%, your RevPAR is $120.
Ultimately, dynamic pricing tools are designed to optimize RevPAR because it reflects your overall revenue efficiency.
Why Metric-Driven Evaluation Matters for Pricing Tools
We are seeing a major shift from “gut-feeling” pricing to data-driven strategies informed by market signals and testing protocols. While property management automation speeds up the process, it doesn’t replace human judgment. It must be validated against actual outcomes using pacing reports and market comps. To make your results tangible, you should track your performance before and after implementing a tool.
The 8-Step Process to Validate Your Pricing Tool
Step 1: Define Your KPIs and Targets
Don’t start a trial without a scoreboard. Establish your KPIs—ADR, occupancy, RevPAR, lead time, and cancellations—and set time-bound targets for each. Segment these by region, unit type, or season. Below is a sample table that you can use to track your KPIs.
| KPI | Definition | Target | Notes |
| ADR | Avg revenue per sold night | $165 | 2BR units, Summer |
| Occupancy | % of available nights sold | 80% | Urban properties |
| RevPAR | ADR × Occupancy | $132 | Portfolio-wide |
| Lead Time | Days between booking & arrival | 28 Days | Coastal properties |
Step 2: Audit Data Inputs for Accuracy
A pricing tool is only as good as the data it consumes. Ensure your tool uses market-aware signals rather than static snapshots. Booking pace—how your current reservations compare to the same time last year—is the most important signal for catching demand shifts early.
- Historical Data: Ensure you have 2–3 years of clean, “de-duped” data.
- Forward Pacing: Compare YOY (Year-Over-Year) trends weekly.
- Local Events: Verify the tool recognizes local festivals or holidays that spike demand.
- Channel Mix: Account for platform-specific fees and commissions when calculating Net ADR.
Step 3: Confirm Integrations (PMS & Channel Managers)
Your pricing tool needs to talk to your Property Management System (PMS) and Channel Manager without a stutter. If rates don’t sync in real-time, you risk overbookings or lost revenue. Test the full cycle in a staging environment to ensure parity across all booking channels.
Step 4: Test Pricing Output Against Benchmarks
Don’t take the tool’s word for it; run a controlled test. Compare the tool’s recommendations against your old manual strategy during similar demand windows. Focus on the RevPAR uplift—if the tool raises ADR but crashes occupancy (or vice-versa), the RevPAR will tell the true story.
Step 5: Evaluate Rule Flexibility and Control
You need a tool that allows for “human-in-the-loop” overrides. Rule flexibility is essential for maintaining your specific vacation rental brand strategy.
- Minimum Stays: Can the tool automatically fill “orphan nights”?
- Guardrails: Can you set pricing floors and ceilings to protect owner interests?
- Decay Curves: Does it offer sophisticated last-minute discounting that increases as the stay date approaches?
Step 6: Examine Reporting and Visibility
You need dashboards that translate complex pricing decisions into executive-ready narratives. Look for tools that offer:
- Projected RevPAR and future occupancy trends.
- Audit trails that show exactly who changed a rate and why.
- The ability to export data into your own BI (Business Intelligence) pipelines.
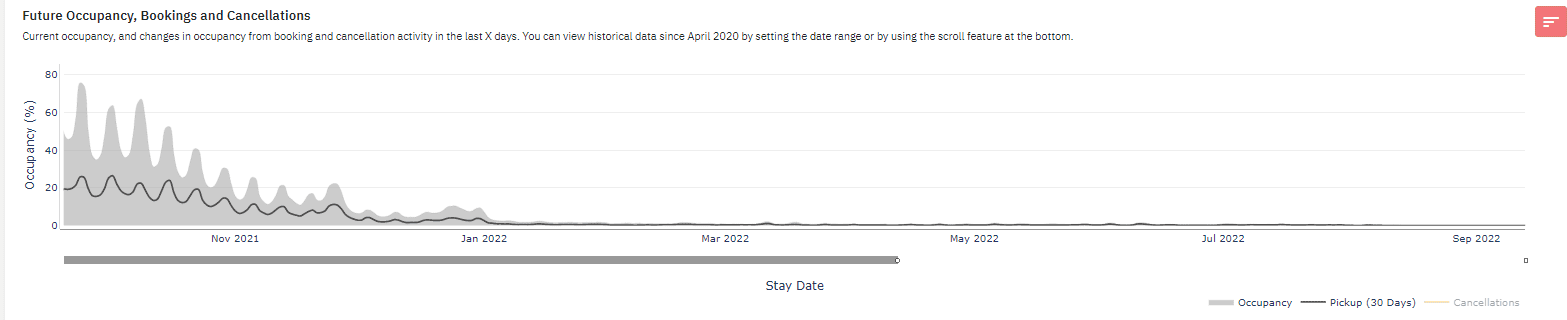
Beyond internal metrics, true visibility requires a deep dive into the local landscape to understand why your numbers are moving. PriceLabs’ Neighborhood Data provides this context by layering your property’s performance against a hyper-local competitive set. It allows you to compare your rates against the calendars of up to 10 specific competitors, monitor local hotel pricing, and utilize Percentile Rankings (25th to 90th) to ensure your property is positioned correctly for its value. By combining future occupancy trends with downloadable CSV data, you gain a transparent, “executive-ready” view of exactly how you stack up against the street-level market in real-time.
Step 7: Assess Scalability, Pricing, and Support
Consider the total cost of ownership, not just the monthly license fee. Does the vendor offer tiered pricing for large portfolios? How responsive is their support team? In 2026, the most valuable partners are those that provide “explainable” automation—helping you understand the why behind the price.
Step 8: Prepare Operational Readiness
Success requires a structured internal process. Define who has the authority to override the algorithm, and set a regular cadence (weekly or monthly) for reviewing KPI performance. Automation works best when it’s governed by clear roles and transparent documentation.
Frequently Asked Questions
How do the core metrics work together?
Occupancy tells you if you’re booked, ADR tells you at what price, and RevPAR tells you if that combination is actually making you the most money possible.
What data is essential?
You need a “spotless” foundation of clean historical RevPAR, forward-looking booking pace, hyper-local competitor data, and net ADR adjusted for channel-specific fees and commissions.
How do I build team trust?
Use audit trails and transparent dashboards. When your team can see the logic behind a price change, they are much more likely to support the system.