Table of Contents
Updated : Apr 6, 2026
Key Takeaways
- The data provided is for the entire country of Austria from August 2023 to October 2024.
- The Average Daily Rate (ADR) was the highest in February 2024 at 179€ and the lowest in September 2024 at 126€. The Revenue per Available Room (RevPAR) peaked in August 2023 at 103€ and dipped to its lowest at 26€ in October 2024.
- Occupancy rates was the highest in August 2023 at 65% and the lowest in October 2024 at 19%. Average bookings stayed relatively stable around 3; however, it dropped to 0 from August 2024 onwards.
- The count of active listings was highest in August 2024 at 50183 and lowest in November 2023 at 43170.
- Overall, the hospitality industry in Austria experienced fluctuations in key performance indicators during the given period. A significant downturn in both ADR, RevPAR, and average bookings was observed starting from August 2024. More analysis is needed to understand this abrupt fall.
ADR Summary
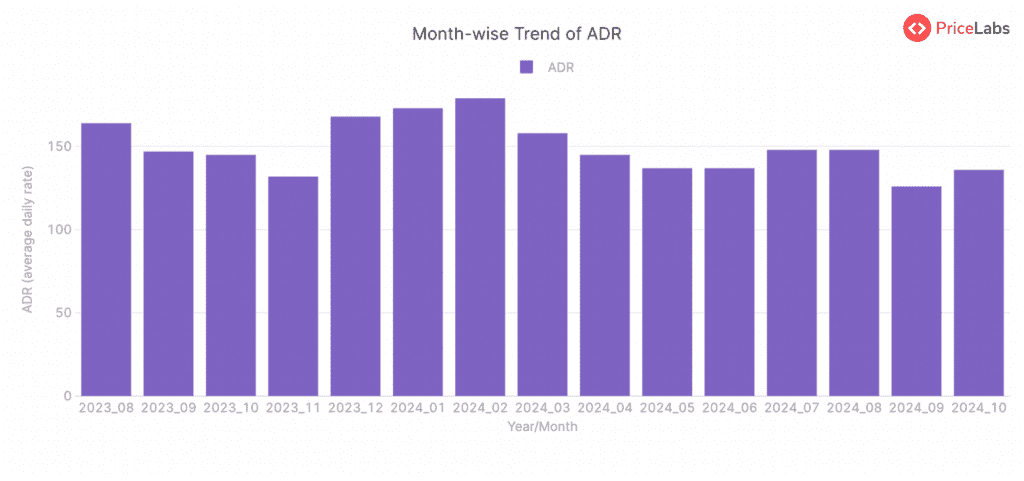
The provided data gives a historical trend of the Average Daily Rate (ADR) for the whole of Austria from August 2023 to October 2024. In August 2023, the ADR was 164€, which dropped to 147€ in September 2023. By October 2023, the ADR had marginally decreased to 145€, with a more substantial decrease in November to 132€. December saw a significant increase to 168€.
The ADR saw a continuous increase in the first two months of 2024, peaking at 179€ in February. After this, there was a decline in March to 158€ followed by a sharper decrease in April to 145€. The downward trend extended into May and June, where the ADR remained consistent at 137€.
In the months of July and August, the ADR showed a slight improvement to 148€. However, the ADR once again reduced from September 2024 to 126€ and showed a slight increase in October 2024 to 136€.
Overall, the ADR showed fluctuations over the said period, with the highest value observed in February 2024 at 179€ and the lowest in September 2024 at 126€. The ADR seems to have some seasonal variations, increasing in the final quarter of the year and early into the next year, then decreasing in the spring and summer months.
RevPAR Summary
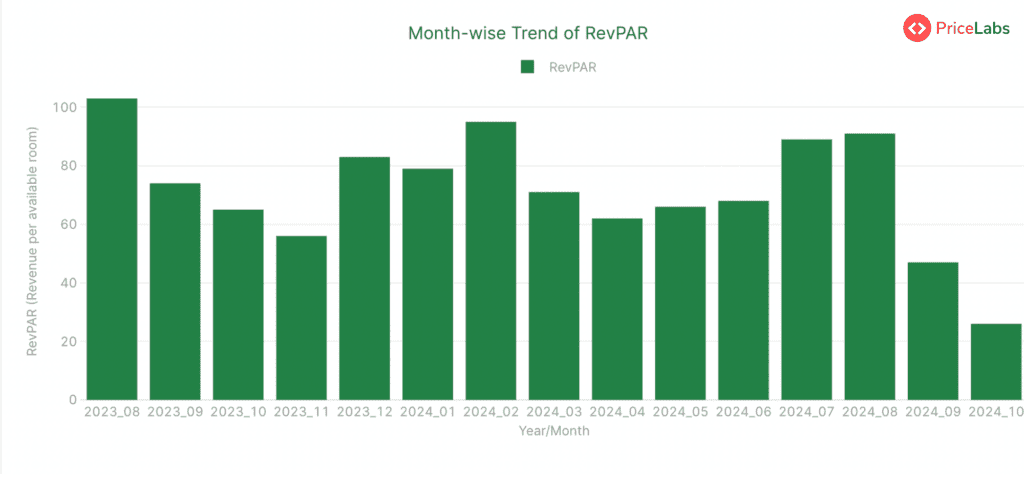
The Revenue per Available Room (RevPAR) data for Austria, from August 2023 to October 2024, shows a variating trend. In August 2023, the RevPAR was at its peak with 103€. A decline was observed in the subsequent months, reaching the lowest in November 2023 at 56€. However, in December 2023, the RevPAR bounced back to 83€, only to fall again slightly in the following months, reaching 79€ in January 2024.
Over the next few months, the RevPAR shows an upside-down ‘U’ shaped trend. It rose to 95€ in February 2024, then gradually decreased to 62€ in April 2024, before climbing up once again to 66€ in May 2024.
From June 2024 to August 2024, the RevPAR followed a rising trend, reaching as high as 91€. Post-August, a steep decline was noticed with RevPAR falling to 47€ in September 2024 and further dropping to 26€ in October 2024. Overall, the trend suggests a degree of seasonality, with higher RevPAR observed during winter (December) and summer (August) months with relative lows during spring (April) and autumn (November).
Read here: How to Calculate RevPAR.
Occupancy Rate Summary
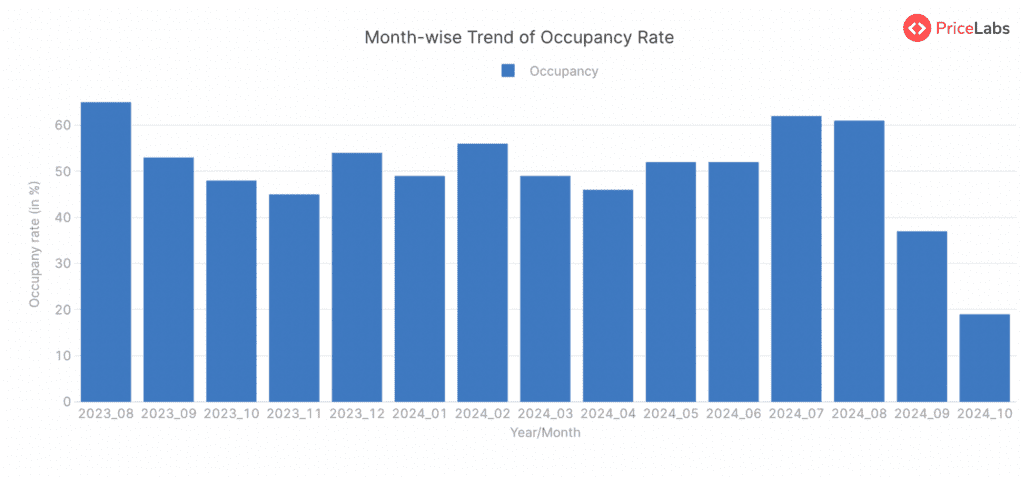
The occupancy rate for accommodations in Austria experienced various fluctuations from August 2023 to October 2024. It started at 65% in August 2023 and slightly decreased to 53% in September 2023. It kept declining over the subsequent two months, reaching a minimum of 45% in November 2023. In December 2023, the occupancy rate went up to 54% before dipping down again to 49% in January 2024.
In February 2024, however, it rose again to 56% but then started another downward trend until April 2024, when it hit a low of 46%. For both May and June 2024, a moderate increase occurred, with rates stabilizing at 52%. The occupancy rate witnessed a notable rise in July and August 2024, peaking at 62% and 61% respectively. An abrupt decrease was observed in September 2024, plummeting to 37%, which further drastically fell to 19% in October 2024.
In general, the pattern suggests higher occupancy during the summer months (July and August), possibly due to vacationers and tourists, and a trend of lower occupancy in the autumn and winter months.
Read here: How to Calculate Occupancy Rate.
Avg. Bookings Summary
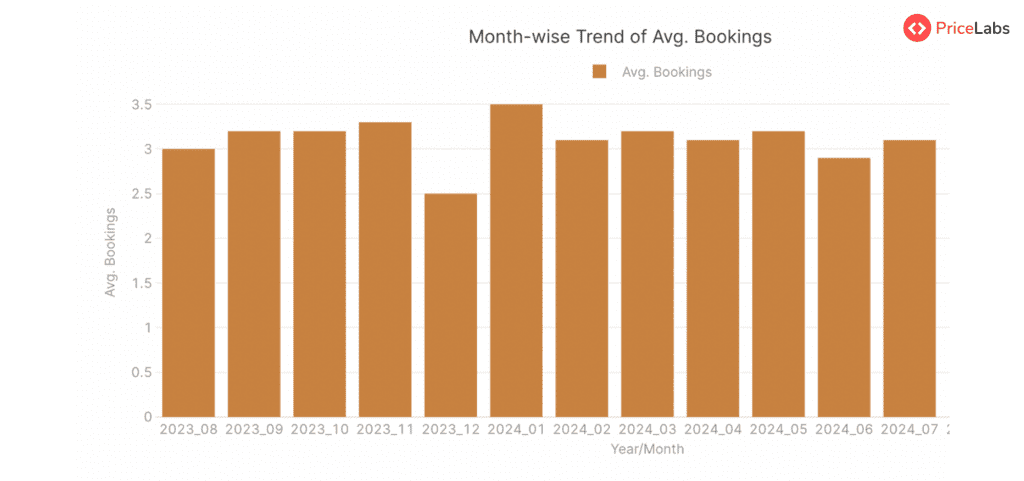
The average bookings in Austria demonstrated a fairly regular pattern from August 2023 to July 2024, fluctuating slightly without any significant leaps or drops. The number started from 3.0 in August 2023, rose to a peak of 3.5 in January 2024, and then returned to a relatively unchanged level of approximately 3.1-3.2 from February to July 2024. Then, a drastic change happened in August 2024 when the average bookings suddenly dropped to 0 and remained at this level for the rest of the monitored period until October 2024. As such, while the first year shows some slight fluctuation, the latter months suggest a sudden halted activity in bookings for the entire country.
Count of Active Listings Summary
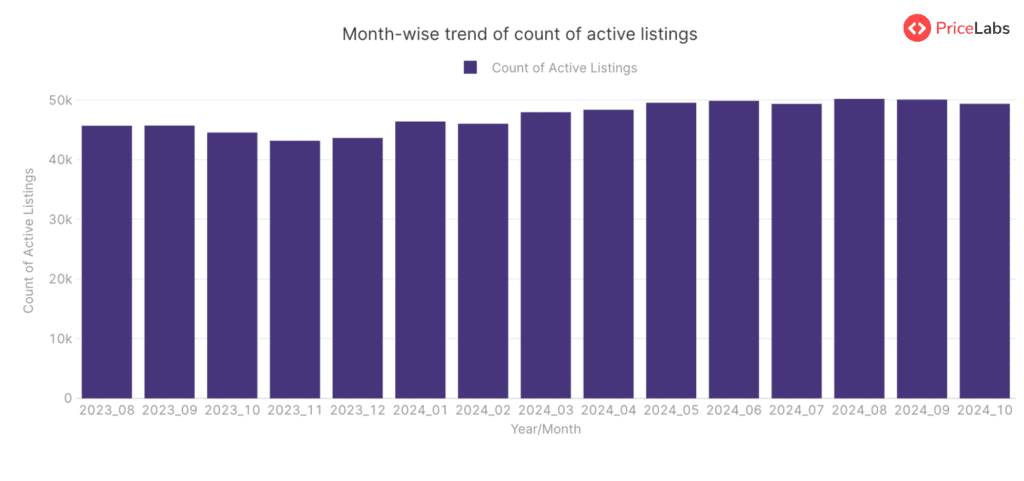
The trend in the count of active listings for entire Austria shows a gradual increase from August 2023 through October 2024, with a few minor drops. In August 2023, the number of active listings was 45,687, which climbed to 45,708 in September 2023. The count of listings decreased to 44,542 in October and continued to decrease to 43,170 in November 2023. The numbers picked up again in December 2023, reaching 43,646, and sharply increased to 46,393 by January 2024. The active listings hovered around 46,000 for February 2024, slightly shrank to 47,956 in March, and continued increasing to peak at 49,858 in June 2024. From there, the count of listings slightly dropped to 49,347 in July 2024 before surging again to the highest of 50,183 in August 2024. Thereafter, the active listings slightly decreased to 50,068 in September and further dropped to 49,358 by October 2024. However, the overall trend from August 2023 to October 2024 shows a net increase in the count of active listings in Austria.
Get actionable market insights from PriceLabs’ Market Dashboards.
About Short-term Rental Index
The World STR (Short-term Rental) Index by PriceLabs is a free tool for tracking short-term rental market performance worldwide. It offers data from Airbnb markets worldwide, refreshed monthly. You can access free insights on which locations are gaining or losing popularity. Key features include:
Compare: Compare year-over-year metrics like active listings, occupancy rates, RevPAR, and ADR.
Trend: Visualize how metrics have changed over the past years.
Pacing: Compare upcoming year metrics to the previous year for occupancy, ADR, and RevPAR.