Table of Contents
Updated : Jan 14, 2026
Smart hosts and real estate investors know that successful short-term rentals are built on insight. Before buying a property, adjusting your prices, or even choosing which neighborhood to invest in, you need reliable data to back your decisions. That’s where an Airbnb research tool comes in. These tools transform raw Airbnb data into actionable insights, enabling you to understand demand trends, occupancy rates, nightly pricing, and competition in any market worldwide.
By using professional Airbnb market research tools, you can analyze how listings in your area perform, spot seasonal patterns, and identify the revenue potential of any property before you list it.
Whether you’re running one property or a growing portfolio, research-driven hosts use data to make smarter choices—like where to expand, when to adjust pricing, and how to position their listings for higher visibility.
In this guide, we’ll show you how to perform practical Airbnb rental market analysis using PriceLabs’ built-in research tools—Market Dashboards, Neighborhood Data, and Comp Sets—to make confident, data-backed decisions every time.
Why Airbnb Market Research Matters
Airbnb market research is the backbone of every profitable short-term rental business. It helps you make data-driven decisions instead of relying on guesswork or intuition. With an Airbnb market research tool, you can identify how different markets perform, what guests are paying, and how to price your property competitively.
Whether you’re a first-time host or a real estate investor analyzing potential STR markets, Airbnb rental market analysis helps you:
- Evaluate market potential: Understand occupancy rates, nightly rates, and revenue per available rental before entering a new city or neighborhood.
- Compare property types: See how 1-bedroom apartments, 2-bedroom homes, or villas perform in different locations.
- Track demand seasonality: Identify high and low seasons to plan pricing, promotions, and maintenance schedules effectively.
- Assess competition: Study how similar listings are priced, what amenities they offer, and how they’re performing throughout the year.
- Forecast profitability: Use Airbnb research tools to project monthly and annual income before investing.
For investors, Airbnb market research is often the difference between buying a high-performing asset and an underperforming one.
Ultimately, effective Airbnb market research gives you control. It enables you to spot opportunities early, adapt to changes quickly, and price your property with confidence. When combined with dynamic pricing tools like PriceLabs, your research doesn’t just inform strategy—it actively drives better revenue performance.
What Is an Airbnb Research Tool and What Does It Do?
An Airbnb research tool is designed to help hosts and investors understand how the short-term rental market behaves in real time. Instead of relying on outdated reports or guesswork, you can use Airbnb research tools to access live market data—everything from pricing and occupancy to demand patterns and property performance.
These platforms collect and analyze publicly available Airbnb data to create a clear picture of what’s happening in your chosen market. Whether you’re planning to buy a new property or optimize your current one, an Airbnb market research tool shows you exactly where you stand compared to competitors.
By combining Airbnb market research with dynamic pricing, PriceLabs bridges the gap between research and revenue—helping you not only understand the market but act on it immediately.
Step-by-Step: How to Research an Airbnb Market with PriceLabs
When it comes to short-term rental research, PriceLabs gives hosts and investors an edge through three powerful features — Market Dashboards, Neighborhood Data, and Comp Sets. Together, they form a complete Airbnb research toolkit that helps you move from data discovery to pricing action in minutes.
Here’s how to perform your Airbnb market research step-by-step:
Step 1: Start with Market Dashboards — Identify Promising Markets
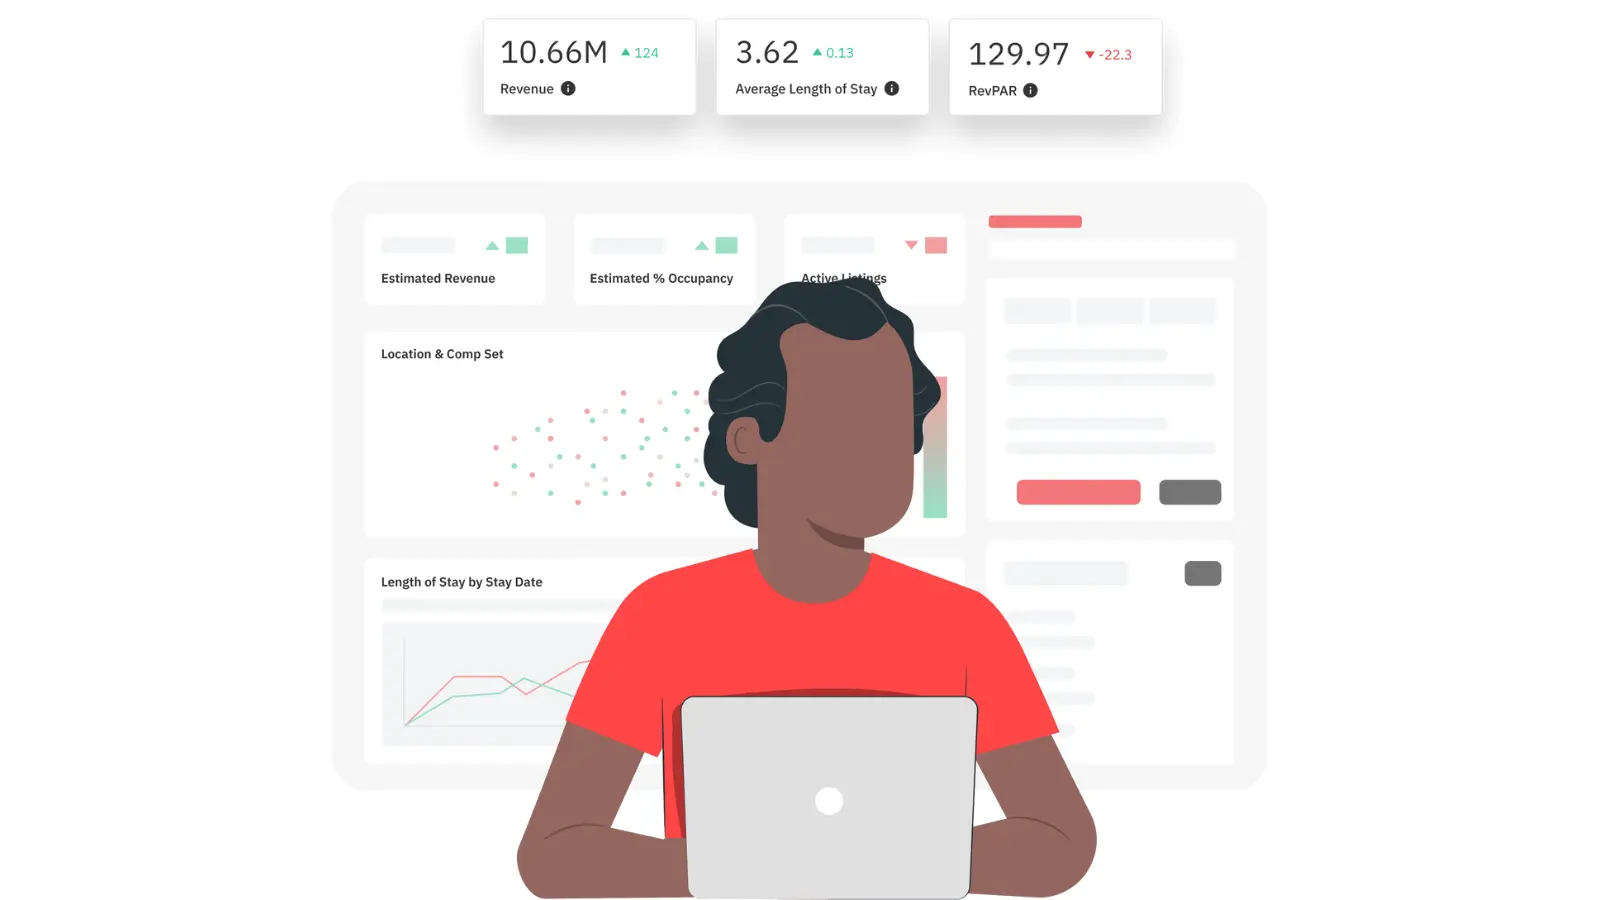
If you’re exploring a new city or evaluating where to invest next, Market Dashboards is the best place to start. This feature aggregates live Airbnb data to give you a snapshot of overall market performance.
With Market Dashboards, you can:
- Compare markets globally: See occupancy rates, ADRs, RevPAR, and available listings across multiple regions.
- Spot market trends: Identify which destinations are growing, slowing, or stabilizing.
- Filter by property size: Analyze performance by 1-bedroom, 2-bedroom, or 3-bedroom listings.
- Track performance over time: Visualize how rates and demand shift month to month.
Example: You might discover that 2-bedroom listings in Lisbon have higher occupancy but slightly lower ADR than similar homes in Barcelona. That insight could shape where to invest next or what kind of property to target.
Stay Ahead of the Market and Find the Right Amenities that Your Potential Guests Want Using PriceLabs Market Dashboard.
Use PriceLabs Market Dashboard and Neighborhood Data to track competitor pricing and demand shifts and analyze past performance to set a strong pricing strategy for your property.
Create your Market Dashboard NowBy using Market Dashboards as your Airbnb market research tool, you can perform high-level Airbnb rental market analysis without juggling multiple sources — all from one interactive view.
Step 2: Deep Dive into Neighborhood Data — Understand Local Demand and Seasonality
Once you’ve identified a promising city or market, zoom in further using Neighborhood Data. This tool lets you analyze short-term rental performance within a small, hyperlocal radius — often as tight as one kilometer.

With Neighborhood Data, you can:
- Evaluate submarkets: Compare specific neighborhoods within a city to identify which areas outperform others.
- Understand demand patterns: Analyze occupancy rates, lead times or booking window, and length-of-stay metrics for precise planning.
- Segment by property type: Focus on similar listings (e.g., entire homes vs. private rooms) to get apples-to-apples insights.
- Forecast seasonality: Identify when bookings surge or slow down to optimize pricing or marketing campaigns.
For instance, a host in Sydney could discover through Neighborhood Data that coastal properties see higher average daily rates in December–February, while downtown studios perform better during business travel months. These details make your Airbnb rental market analysis not just data-driven, but profit-driven.
Step 3: Build a Comp Set — Benchmark Against Similar Listings
After understanding your local market dynamics, it’s time to measure your property’s performance against similar ones using Comp Sets.
A competitive set is a custom group of Airbnb listings that closely match your property in terms of size, amenities, location, and quality. With PriceLabs, you can handpick these listings and automatically track their performance.

Use Comp Sets to:
- See where you stand: Compare your occupancy rate, ADR, and revenue to similar properties.
- Identify pricing gaps: Spot whether your listing is overpriced or underpriced compared to direct competitors.
- Track trends: Monitor how nearby listings adjust their prices during peak or off-seasons.
- Benchmark performance: Evaluate how your Airbnb property performs against the local standard.
If you’re wondering how to analyze an Airbnb property effectively, Comp Sets provide the clearest benchmark. You’ll instantly see whether your property is outperforming the market or needs strategic adjustments.
Step 4: Translate Insights into Action
Market research has real impact only when you act on it. PriceLabs makes that easy by connecting research insights directly to your dynamic pricing setup.
Here’s how to turn Airbnb market research into results:
- Adjust your base price: Use average ADRs and occupancy data from your Market Dashboard as a reference point.
- Set smart minimum and maximum prices and minimum stays: Protect your margins while staying competitive year-round.
- Leverage seasonality: Utilize insights from Neighborhood Data to adjust prices automatically during periods of high or low demand.
- Refine weekly or monthly discounts: Match length-of-stay trends uncovered in your Airbnb analytics tool.
Dynamically Price Your Property and Get FREE Custom Reports Tailored To Your Property!
Use PriceLabs Dynamic Pricing to competitively and dynamically price your property according to demand shifts and analyze past performance to set a strong pricing strategy for your property.
Create your Account NowHow to Analyze an Airbnb Property Before Investing
A structured Airbnb rental market analysis uses both macro and micro data: market-level performance metrics and property-specific insights. Here’s how to combine both using PriceLabs:
1. Use Market Dashboards to Estimate Earning Potential
Start by pulling data for your target city or region using Market Dashboards. Look at:
- Average Daily Rate (ADR): Helps estimate nightly income.
- Occupancy Rate: Indicates the frequency at which listings are booked.
- Revenue per Available Rental (RevPAR): Combines ADR and occupancy for a complete earnings picture.
For example, if Market Dashboards show that 2-bedroom properties in Austin average $180 ADR with 70% occupancy, you can calculate: Projected Monthly Revenue = $180 × 0.7 × 30 = ~$3,780
From here, compare these averages to your property’s expected costs — mortgage, management, cleaning, utilities — to calculate your expected ROI.
2. Validate the Location with Neighborhood Data
After shortlisting a property, zoom in using Neighborhood Data to confirm it’s in a high-performing micro-market.
- Check occupancy trends within a 1 km radius.
- Identify how nearby listings perform seasonally.
- See which property types and bedroom counts perform best.
This micro-level Airbnb market research ensures you don’t invest in an underperforming area of an otherwise strong city. It’s especially valuable for investors comparing neighborhoods with similar property prices but different guest demand.
3. Compare with Competitors Using Comp Sets
The next step is benchmarking. Use Comp Sets to find similar listings and evaluate their pricing, amenities, and occupancy rates.
- If nearby listings with comparable features achieve higher occupancy rates, you may need to adjust your base price or amenities accordingly.
- If your property outperforms others, you’re in a strong position to scale pricing or replicate success elsewhere.
Comp Sets effectively turn Airbnb analytics tools into a performance mirror — helping you see how your property stacks up and what tweaks could improve profitability.
4. Calculate ROI and Payback Period
Now connect your research to investment logic. Using the data gathered:
- Estimate Gross Annual Revenue: From Market Dashboards or Comp Set averages.
- Subtract Operating Expenses: Management, cleaning, utilities, insurance, taxes.
- Estimate Net Operating Income (NOI): NOI = Annual Revenue – Operating Expenses
- Calculate ROI: ROI = (NOI ÷ Property Cost) × 100
- Determine Payback Period: Payback = Property Cost ÷ Annual NOI
With this approach, you’re basing investment decisions on real, verifiable data from your Airbnb market research tool.
5. Reassess Regularly
Airbnb markets evolve constantly. Seasonality, regulations, and competition can all shift within months. Use PriceLabs to refresh your dashboards quarterly and monitor new supply, changing ADRs, and booking lead times. Continuous analysis helps you stay ahead of the curve — turning market shifts into opportunities rather than threats.
Performing this level of Airbnb rental market analysis before investing ensures you’re making informed decisions with clear expectations. With PriceLabs’ Market Dashboards, Neighborhood Data, and Comp Sets, you can go from raw market data to confident investment choices in minutes — saving time, reducing risk, and maximizing ROI.
Pro Tips and Common Mistakes in Airbnb Research
Using an Airbnb analysis tools like PriceLabs gives you powerful insights—but how you interpret and apply those insights determines your success. Here’s how to make your Airbnb rental market analysis more accurate and avoid common pitfalls along the way.
Pro Tips for Smarter Airbnb Market Research
- Update your data often: Airbnb markets shift quickly. Refresh your dashboards regularly to stay aligned with current occupancy and pricing trends.
- Segment your analysis: Compare similar listings by bedroom count or property type rather than relying on citywide averages.
- Watch for seasonality: Use Neighborhood Data to spot when demand rises or dips, and adjust pricing accordingly.
- Benchmark competitors: Use Comp Sets to see how your listing compares in occupancy and ADR—and identify quick wins.
- Combine data with context: Pair insights from your Airbnb analytics tool with local knowledge such as events, regulations, or tourism shifts.
Common Mistakes to Avoid
- Relying on outdated data: Markets evolve monthly—don’t base pricing on last year’s averages.
- Overgeneralizing by city: Local pockets perform very differently; zoom in using Neighborhood Data.
- Ignoring booking behavior: Overlooking lead times or stay lengths can cause missed revenue opportunities.
- Comparing mismatched listings: Benchmark against similar properties only.
- Not acting on insights: Data alone won’t improve performance—tie research to dynamic pricing actions within PriceLabs.
When you use your Airbnb research tools strategically—and avoid these traps—you move from reactive hosting to proactive, data-driven decision-making.
Conclusion – Research Smarter, Earn Smarter
Success depends on great data supported by a great property. With the right Airbnb research tool, you can identify high-performing markets, understand local demand, and benchmark your listings against real competitors.
PriceLabs’ suite of research features—Market Dashboards, Neighborhood Data, and Comp Sets—transforms Airbnb market research from a guessing game into a data-driven system. You’ll know exactly where to invest, how to price, and when to adjust, all backed by real-time Airbnb analytics.
Whether you’re evaluating your next investment or fine-tuning your existing listings, continuous Airbnb rental market analysis keeps you ahead of market changes and demand swings. The difference between good and great hosts isn’t luck—it’s insight.
Start your Airbnb research with PriceLabs today to uncover market opportunities before your competitors do—and turn every data point into higher occupancy, smarter pricing, and stronger returns.