
Table of Contents
Updated : Mar 3, 2026
Coachella remains one of the most important revenue weekends of the year for short-term rental hosts in the Indio market. But beyond the buzz, how did performance actually shift year-over-year? And what does the data say about Weekend 1 vs Weekend 2 in 2026?
Using event-specific performance metrics — including Booked Nights, Occupancy, ADR, and RevPAR — we analyzed how Coachella performed in 2026 compared to 2025 (STLY), and how the two 2026 weekends stacked up against each other.
Weekend 1: 2025 vs 2026
Event dates analyzed:
- 2026: April 9–12
- 2025 (STLY): April 10–13
Performance Comparison — Weekend 1
| Metric | 2025 | 2026 | % Change |
|---|---|---|---|
| Booked Nights | 21,422 | 32,862 | +53% |
| Occupancy | 60.6% | 78.2% | +29% |
| ADR | $3,324 | $3,692 | +11% |
| RevPAR | $2,016 | $2,886 | +43% |
What Changed?
Weekend 1 saw significant year-over-year growth across all key metrics.
- Booked Nights increased by 53%, indicating substantially stronger demand.
- Occupancy jumped from 60.6% to 78.2%, a nearly 18-point increase.
- ADR grew by 11%, suggesting hosts successfully pushed rates higher.
- RevPAR surged 43%, showing that higher prices and stronger occupancy compounded into major revenue gains.
The data suggests 2026 Weekend 1 had both stronger compression and pricing power compared to 2025. Demand did not just increase — hosts were able to convert it efficiently at higher nightly rates.
Weekend 2: 2025 vs 2026
Event dates analyzed:
- 2026: April 16–19
- 2025 (STLY): April 17–20
Performance Comparison — Weekend 2
| Metric | 2025 | 2026 | % Change |
|---|---|---|---|
| Booked Nights | 15,738 | 27,715 | +76% |
| Occupancy | 44.5% | 65.9% | +48% |
| ADR | $2,263 | $2,688 | +19% |
| RevPAR | $1,008 | $1,772 | +76% |
What Changed?
Weekend 2 experienced even more dramatic year-over-year growth than Weekend 1.
- Booked Nights increased 76%, indicating a strong rebound.
- Occupancy rose from 44.5% to 65.9%, a 21-point jump.
- ADR increased by nearly 19%, showing stronger pricing confidence.
- RevPAR climbed 76%, meaning revenue per available night nearly doubled.
Weekend 2 in 2025 significantly lagged behind Weekend 1 in occupancy and revenue. But in 2026, the gap narrowed meaningfully. This signals improved demand distribution across both festival weekends.
Weekend 1 vs Weekend 2 (2026)
Now let’s compare the two 2026 weekends directly.
2026 Weekend Comparison
| Metric | Weekend 1 | Weekend 2 | Difference |
|---|---|---|---|
| Booked Nights | 32,862 | 27,715 | W1 +19% |
| Occupancy | 78.2% | 65.9% | W1 +12.3 pts |
| ADR | $3,692 | $2,688 | W1 +37% |
| RevPAR | $2,886 | $1,772 | W1 +63% |
Key Takeaways
Even though Weekend 2 improved significantly year-over-year, Weekend 1 remains the premium weekend:
- ADR is 37% higher on Weekend 1
- RevPAR is 63% higher
- Occupancy remains stronger by 12+ percentage points
This reinforces a familiar pattern: Weekend 1 commands pricing power. However, the strong 2026 growth on Weekend 2 suggests demand is becoming more evenly distributed compared to 2025.
For hosts, this means that Weekend 2 should not be discounted too aggressively — especially in strong-demand years.
Insights for Hosts: What the Data Really Means
The 2026 data highlights three major trends:
1. Demand Is Stronger and More Balanced
Both weekends experienced strong YoY growth, especially Weekend 2. This suggests improved booking confidence and broader guest willingness to attend either weekend.
2. Pricing Power Has Increased
ADR growth on both weekends (11% on W1, 19% on W2) indicates hosts successfully pushed rates without suppressing occupancy.
3. RevPAR Gains Come From Strategy, Not Just Demand
The largest gains came from combining higher occupancy with higher ADR. Hosts who optimized pricing dynamically likely captured disproportionate revenue upside.
How PriceLabs Helps Hosts Capture Event Revenue
Large-scale events like Coachella create compressed demand windows. The difference between average and top-performing hosts often comes down to pricing precision and portfolio visibility.
Dynamically Price Your Property and Get FREE Custom Reports Tailored To Your Property!
Use PriceLabs Dynamic Pricing to competitively and dynamically price your property according to demand shifts and analyze past performance to set a strong pricing strategy for your property.
Create your Account NowHere’s where the right tools matter:
1. Dynamic Pricing
Event demand shifts quickly. Dynamic Pricing automatically adjusts nightly rates based on real-time market data, booking pace, and lead time — helping hosts avoid underpricing early or overpricing too late.

2. STR Index
The STR Index helps hosts benchmark their performance against the broader market. During Coachella, knowing whether your occupancy and ADR are outperforming or lagging the market is critical.
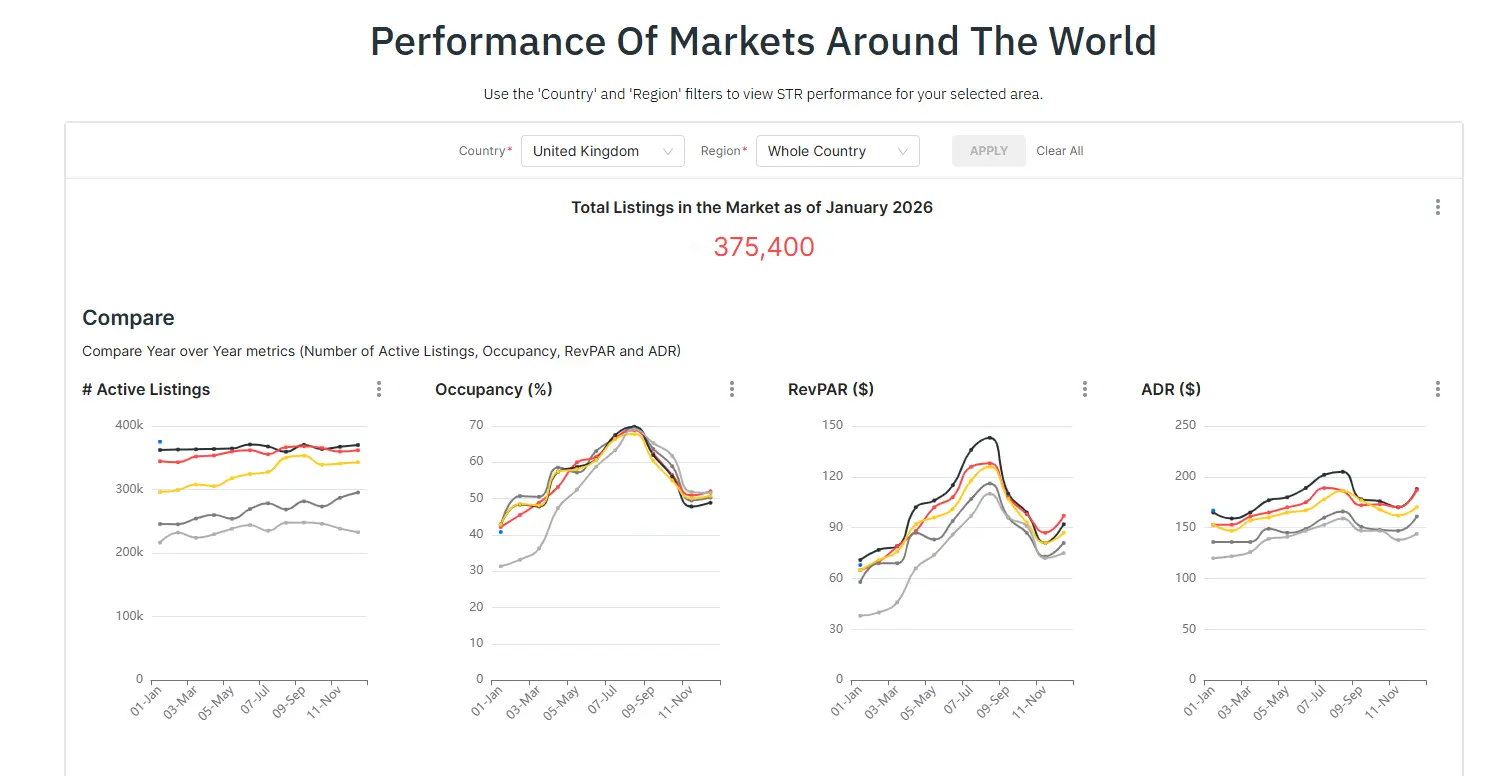
3. Market Dashboards
Market Dashboards allow hosts to visualize:
- Booking pace
- Occupancy trends
- ADR shifts
- Event compression curves
This helps identify exactly when demand begins accelerating for Weekend 1 vs Weekend 2.
4. Portfolio Analytics
For multi-listing hosts, Portfolio Analytics reveals:
- Which listings are outperforming
- Which units are lagging
- Where pricing adjustments are needed
Event weekends often expose inconsistencies across listings. Portfolio-level visibility prevents missed revenue.
5. Listing Optimizer
Even during high-demand events, conversion matters. Listing Optimizer helps identify improvements in pricing, amenities, and positioning that increase booking probability — especially when competition rises.
With PriceLabs Listing Optimizer You Can Analyze The Quality Of Your Competitor's Listings.
With PriceLabs Listing Optimizer, you will be able to compare your listing with other listings guests would consider your competition and optimize your listing accordingly.
Create your Account NowConclusion
The Coachella 2026 data tells a clear story:
- Demand strengthened significantly year-over-year.
- Weekend 2 saw especially dramatic growth.
- Weekend 1 continues to command premium pricing.
- RevPAR gains were substantial — 43% on W1 and 76% on W2.
For hosts, this reinforces one key principle: event revenue is not automatic. Strong demand creates opportunity — but pricing discipline and performance monitoring determine outcomes.
As Coachella and other mega-events continue to evolve, the hosts who win are those who combine market awareness with a data-driven pricing strategy.
If 2026 is any indicator, future festival seasons will reward those who plan early, monitor booking pace carefully, and adjust intelligently — not reactively.