
Table of Contents
Updated : Feb 17, 2026
Small hosts don’t need a data science team to master seasonality—they need the right signals in one place. Portfolio analytics turns scattered booking data into clear, short-term rental market insights for seasonal pricing, helping you anticipate high vs. low demand and act before it’s too late.
By tracking a few core metrics, benchmarking against your market, and automating dynamic pricing rules, you can lift RevPAR in peak months and defend occupancy in shoulder or low seasons.
This guide shows how to build a simple, centralized workflow—then use it to set smart baselines, tune pricing, align operations, and continuously improve across seasons.
Dynamically Price Your Property and Get FREE Custom Reports Tailored To Your Property!
Use PriceLabs Dynamic Pricing to competitively and dynamically price your property according to demand shifts and analyze past performance to set a strong pricing strategy for your property.
Create your Account NowUnderstanding Seasonality in Short-Term Rentals
Seasonality is the predictable, recurring shift in demand, rates, and occupancy across the year, shaped by weather, holidays, school breaks, and local events. For hosts, the goal isn’t to fight seasonality—it’s to forecast it and prepare for it. That mental shift stops reactive discounting and turns busy and slow periods into planned revenue opportunities.
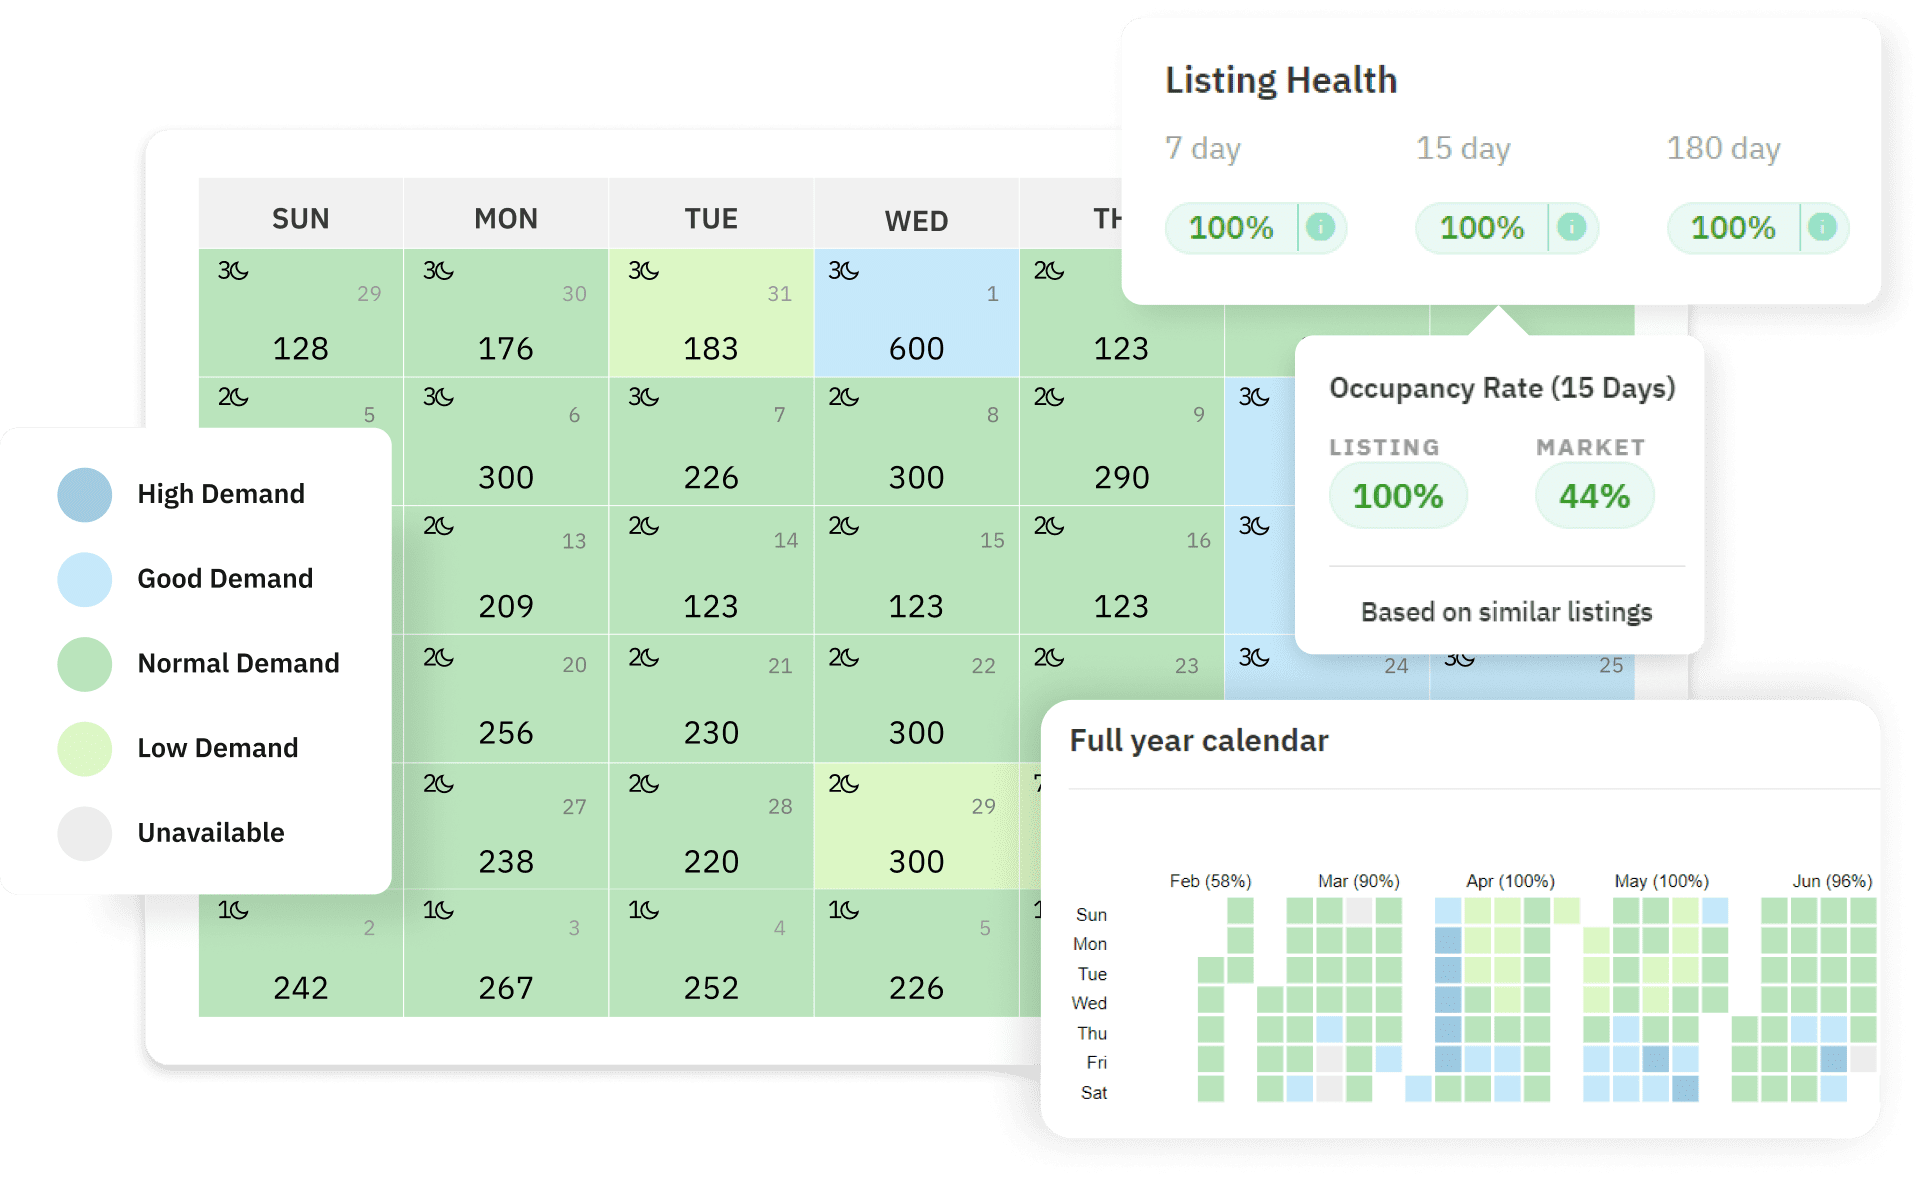
Historical STR data is the fastest way to recognize the turning points. In many markets, occupancy can climb rapidly from winter lows to spring highs. A swing that directly lifts revenue when paired with dynamic rate updates based on Airbnb’s historical performance data. When Portfolio Analytics surfaces these patterns at a glance, hosts can deploy promotions, adjust minimum stays, or raise rates on the right dates—not weeks late.
Key Metrics to Track for Seasonal Strategies
Focus on five metrics that reliably flag seasonal shifts and inform action:
- Occupancy: Percentage of available nights booked.
- ADR (Average Daily Rate): Average revenue per booked night.
- RevPAR (Revenue Per Available Room): ADR × occupancy, showing overall earning power across nights available.
- Pacing: How current bookings compare with your past performance or the local market at the same lead time.
- Projections: Forecasted occupancy and revenue based on historical trends and current pickup.
Pacing is particularly useful: it shows how current bookings compare to past performance or local competitors, helping you spot over- or underperformance early. Tracking these with portfolio analytics helps isolate listing-level issues from broader market shifts and pinpoints where to adjust first.
Example seasonal pattern snapshot (illustrative; replace with your data):
| Metric | Typical Low Season | Typical High Season | What to Watch |
| Occupancy | 35–55% | 70–90% | Pickup pace at 30/60/90 days out |
| ADR | $100–$140 | $160–$240 | Weekends and event premiums |
| RevPAR | $35–$77 | $112–$216 | Conversion after price changes |
Use your historicals and market benchmarks to set these ranges accurately for your portfolio.
Centralizing Data to Build a Portfolio Dashboard
A portfolio dashboard centralizes occupancy, ADR, RevPAR, pacing, and projections across all listings—so one screen answers “What changed?” and “What should I do?” To get there:
- Connect your PMS and channel manager to your analytics and pricing tools so bookings, rates, and availability sync daily.
- Enable your dynamic pricing provider and import market data to enrich your view with benchmarks and demand signals.
- Map listings to consistent naming and tags (location, size, bedroom count) for apples-to-apples comparisons.
- Configure shared metrics (occupancy, ADR, RevPAR) and pacing views at 7/30/60/90-day horizons.
- Set alerts for material variances (e.g., pacing −15% vs. last year, or occupancy <40% inside 21 days).
This integrated stack keeps data flowing with minimal manual effort and shortens the decision-making feedback loop.
All of this can be automated in PriceLabs with Portfolio Analytics and Market Dashboards to gain unified views and alerts.
Dynamically Price Your Property and Get FREE Custom Reports Tailored To Your Property!
Use PriceLabs Dynamic Pricing to competitively and dynamically price your property according to demand shifts and analyze past performance to set a strong pricing strategy for your property.
Create your Account NowDefining Seasonal Baselines and Market Benchmarks
Baselines are your truth: 12–36 months of occupancy and ADR per listing establish what “normal” looks like by month and lead time. This helps you recognize real trend changes vs. one-off anomalies, particularly around seasonal transitions.

Market benchmarks show how you stack up. They’re comparable data from local competitors or market averages, used to set realistic targets and guide pricing. Useful sources include:
- Local comps filtered by bedroom count and neighborhood
- Pacing reports from regional data providers
- Market dashboards that surface event surges and compression
Visualize your listings against baselines and benchmarks using a simple sortable table or scatter plot (e.g., ADR vs. occupancy by month). Outliers reveal opportunities: raise rates where occupancy outpaces the market; add promotions where you lag.
Using Portfolio Analytics to Inform Dynamic Pricing Rules
Dynamic pricing rules are automated criteria that adjust rates based on signals such as occupancy thresholds, booking windows, and events. They translate insights into scalable actions.

With portfolio analytics:
- Identify high-demand windows to apply weekend/event premiums and higher minimum stays.
- Flag soft shoulder weeks to reduce minimum stays, add length-of-stay discounts, or launch gap-filling promotions.
- Control risk by setting floor and ceiling rates by season and property type.
Tools like PriceLabs let you apply these rules at the portfolio level for speed and consistency, while retaining listing-level overrides where needed.
Sample rule framework:
| Trigger (Signal) | Automated Action | Scope | Goal |
| Pacing ≥ +20% vs. last year (60D+) | Increase base rate +8%; min stay +1 night | All urban units | Capture peak willingness to pay |
| Occupancy <35% inside 21 days | Apply 12% discount; enable LOS discount | Coastal studios | Defend occupancy before close-in |
| Citywide event detected | Add +25% premium; 2-night min stay | Entire portfolio | Monetize demand spike |
| Midweek softness flagged | Midweek discount −10% | Suburban homes | Smooth pickup across week |
Dynamically Price Your Property and Get FREE Custom Reports Tailored To Your Property!
Use PriceLabs Dynamic Pricing to competitively and dynamically price your property according to demand shifts and analyze past performance to set a strong pricing strategy for your property.
Create your Account NowMonitoring Booking Pacing and Adjusting Rates Proactively
Weekly reviews prevent last-minute scrambles. Compare current pickup to last year and to your market at 7/30/60/90-day cutoffs (Rental market analysis tool). Then act before the booking window closes.
Quick checklist:
- Check portfolio pacing vs. last year and market for each future month.
- Drill into lagging segments (property type, bedroom count, neighborhood).
- Adjust: lower or raise rates, tweak minimum stays, add LOS discounts, or schedule limited-time promos.
- Reassess in 48–72 hours—keep changes if conversion/pace improves; roll back if not.
- Log changes and results to inform next season’s baselines.
Proactive rate adjustments—small, earlier moves guided by pacing—protect occupancy and RevPAR without panicked discounting later.
Aligning Operations with Seasonality Insights
Operational alignment means matching housekeeping, maintenance, and staffing to forecasted occupancy so you protect reviews and margins.
- Schedule deep cleans, preventive maintenance, and upgrades in low or shoulder seasons when occupancy is light and flexible.
- Staff up and pre-stock consumables ahead of forecasted peaks to avoid service bottlenecks and rush fees.
Example planning map:
| Month (Example) | Forecasted Occupancy | Operational Focus |
| Jan (Low) | 40% | Deep cleans; appliance checks; rate tests |
| Mar (Rising) | 60% | Linen replenishment; staff training |
| Jun–Aug (Peak) | 85–90% | Max housekeeping capacity; backup vendors |
| Oct (Shoulder) | 55% | Minor renovations; photo refresh |
| Dec (Events) | 75% | Amenity upgrades; guest comms templates |
Conducting Post-Season Reviews to Refine Strategy
After each season, compare actuals to baselines and projections to isolate what worked and what didn’t. Focus on RevPAR, ADR, occupancy, and pacing vs. plan.
Use a concise review template:
| Metric | Baseline | Projection | Actual | Variance | Notes / Next Action |
| Occupancy (%) | 72 | 75 | 68 | −7 | Launch promos earlier; reduce min stay at 30D |
| ADR ($) | 185 | 195 | 188 | −7 | Raise ceilings for event weeks |
| RevPAR ($) | 133 | 146 | 128 | −18 | Add midweek pricing tweaks |
| Pacing @60D (%) | +5 vs LY | +8 vs LY | −3 vs LY | −11 | Improve event detection; earlier LOS discounts |
Roll successful tactics across similar listings next season; flag chronic underperformers for repositioning or amenity upgrades.
Dynamically Price Your Property and Get FREE Custom Reports Tailored To Your Property!
Use PriceLabs Dynamic Pricing to competitively and dynamically price your property according to demand shifts and analyze past performance to set a strong pricing strategy for your property.
Create your Account NowPractical Tips for Small Hosts Implementing Portfolio Analytics
- Start small: launch a single portfolio dashboard and 1–2 dynamic pricing rules; expand once you see lift.
- Audit data quality monthly: reconcile blocked dates, cancellations, duplicate listings, and tax/fee mappings so charts reflect reality.
- Pilot changes on high-variance listings first; measure before-and-after on occupancy, ADR, and RevPAR over a full booking window.
- Standardize tags (neighborhood, bedroom count) to speed comparisons and rule targeting.
- Use PriceLabs Market Dashboards for local benchmarks and Portfolio Analytics for unified monitoring (Market Data by PriceLabs).
Frequently asked questions
How do small hosts access and use portfolio analytics tools?
Small hosts can access portfolio analytics by connecting their PMS or channel manager to PriceLabs; once linked, dashboards update daily with occupancy, rates, pacing, and revenue breakdowns.
What are the most important metrics for optimizing seasonal revenue?
Occupancy, ADR, RevPAR, pacing, and projections are the core set; together they reveal when to raise rates, discount, or adjust minimum stays as seasons shift.
How can pacing reports help adjust pricing before low seasons hit?
Pacing shows if bookings are lagging vs. last year or the market, allowing you to add discounts, promotions, or LOS tweaks early—before gaps harden into empty nights.
Is portfolio analytics useful for hosts with only one or two listings?
Yes—centralized analytics replace spreadsheets, highlight trends you might miss per listing, and make it easy to test pricing rules with confidence.
How do market benchmarks improve seasonal pricing decisions?
Benchmarks anchor your targets to local reality, helping you price assertively in peaks and defensively in lulls while ensuring a competitive edge.