
Key Takeaways
The following data from PriceLabs’ Short-term Rental Worldwide Index represents the accommodation industry statistics for the state of Vermont, United States, over a period of three years from January 2021 to November 2023. Over this period, there is a general increase in both the Average Daily Rates (ADR) and Revenue per Available Room (RevPAR), along with minor fluctuations.
- ADR increased from $314 USD in January 2021 to $411 USD in February 2023. The highest ADR was noted in February 2023 ($411 USD).
- RevPAR also showed a similar increasing trend from $181 USD in January 2021 to $236 USD in February 2023.
- Occupancy rates fluctuated between 31% and 62% and peaked in July and August in both 2021 and 2022.
- Average Bookings stood between 2.2 to 3.9 over the given period.
- Furthermore, the count of Active Listings displayed an overall increasing trend, from 7608 listings in January 2021 to 12085 in November 2023.
ADR Summary
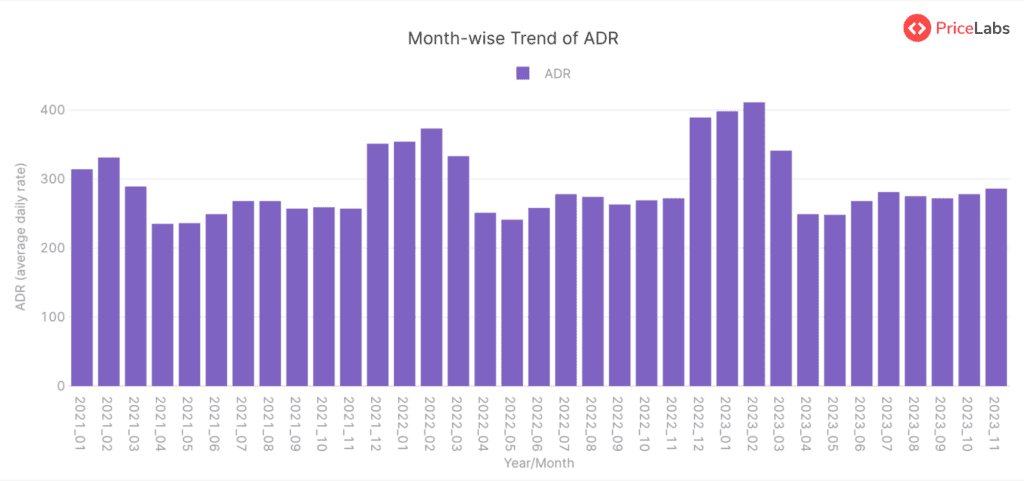
The data indicates varying average daily rates (ADR) in Vermont, United States, from January 2021 to November 2023. Starting from $314 USD in January 2021, the ADR peaked in February 2021 at $331 USD before it dipped to its lowest at $235 USD in April 2021. Subsequently, the ADR experienced a gradual increase until August, reaching $268 USD, then slightly dwindling to $257 USD in November 2021. December 2021 witnessed a sharp surge, reaching $351 USD, and further escalated to $354 USD in January 2022. There was another peak in February 2022 at $373 USD, which diminished to $251 USD by April 2022. From May 2022 onwards, the ADR fluctuated moderately, with noticeable peaks in July ($278 USD), August ($274 USD), October ($269 USD), and a significant peak ($389 USD) in December 2022.
The trend in 2023 displayed similar patterns, with the ADR cresting in February at $411 USD, followed by a considerable decline to $249 USD in April 2023. Thereafter, the ADR moderately fluctuated until October, peaking at $278 USD and eventually reaching $286 USD in November 2023. Overall, there seems to be a seasonal trend where the ADR peaks in the early months of the year, especially in February, and then dips in the spring months, particularly in April.
RevPAR Summary

The RevPAR (Revenue Per Available Room) for Vermont, United States, showed varied trends from January 2021 to November 2023. In the first half of 2021, the RevPAR began at $181 USD in January, rose to $206 USD in February, and then largely fell, reaching its lowest at $88 USD in April before reaching $167 USD in August. This implies that the revenue generated fluctuated heavily in the first half.
During the second half of 2021, from August to December, the RevPAR dropped to $131 USD and then rose moderately and dropped again to reach $104 USD in November before rising to end the year at $175 USD. This part of the year experienced a few highs and lows.
In 2022, the RevPAR started at $185 USD in January, rose to its peak of $222 USD in February, and then fell considerably to $78 USD in April. From April onward, the RevPAR rose slowly, peaking at $159 USD in August, then experienced a steady fall and rose again to end the year at $173 USD.
In the year 2023, the RevPAR began at $190 USD, attained its peak at $236 USD in February, and later fell to $79 USD in April, which seems to be the lowest point over the entire period. Then a steady increase is observed until $145 USD in July, followed by a decrement and a slight increment by the end of the year.
This trend analysis suggests a possible seasonal pattern where RevPAR peaks around February, falls significantly around April, rises until August, and then drops and rises again towards the end of the year.
Read here: How to Calculate RevPAR.
Occupancy Rate Summary
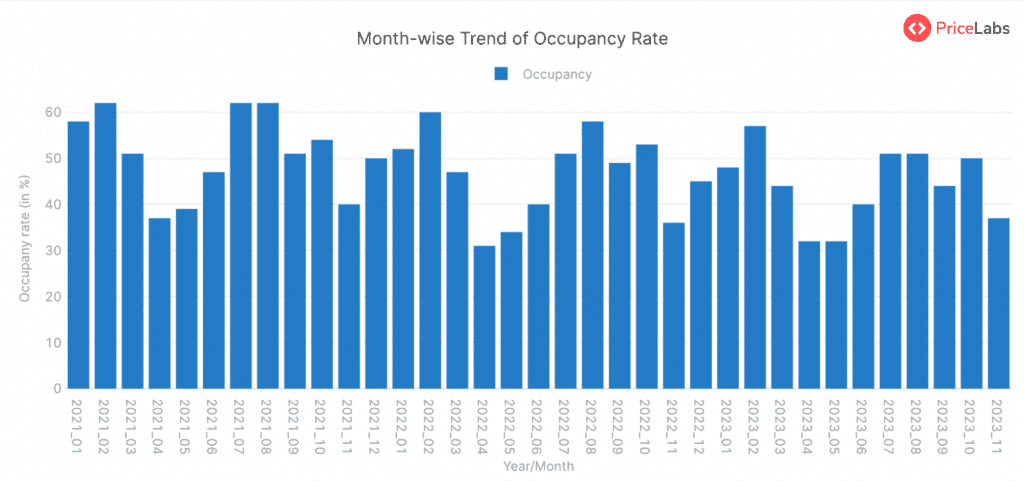
The occupancy rate in the Vermont region of the United States showed fluctuations over time. Starting at 58% in January 2021, it peaked at 62% in February and August that year before dropping to a low of 37% in April 2021. The rate steadily rose again through the summer months, up to 62%, and then slumped towards the year-end to 40% in November 2021 and slightly improved to 50% in December 2021.
In the following year, 2022, the occupancy started at 52% in January and peaked at 60% in February before falling to a low of 31% in April. It then began to gradually climb again through the summer months, reaching 58% in August 2022. Thereafter, it dipped to its lowest at 36% in November 2022 before ending the year at 45% occupancy.
In 2023, the trend seems similar to the previous years, with the occupancy starting at 48% in January and peaking at 57% in February. It then fell to a low of 32% in both April and May. The occupancy showed recovery during summer, reaching 51% in both July and August and then gradually falling towards the end of the year.
In conclusion, the data suggests a seasonal trend in occupancy for the Vermont region, with peaks typically around the summer and winter and dips often seen in the spring and fall months.
Read here: How to Calculate Occupancy Rate.
Avg. Bookings Summary
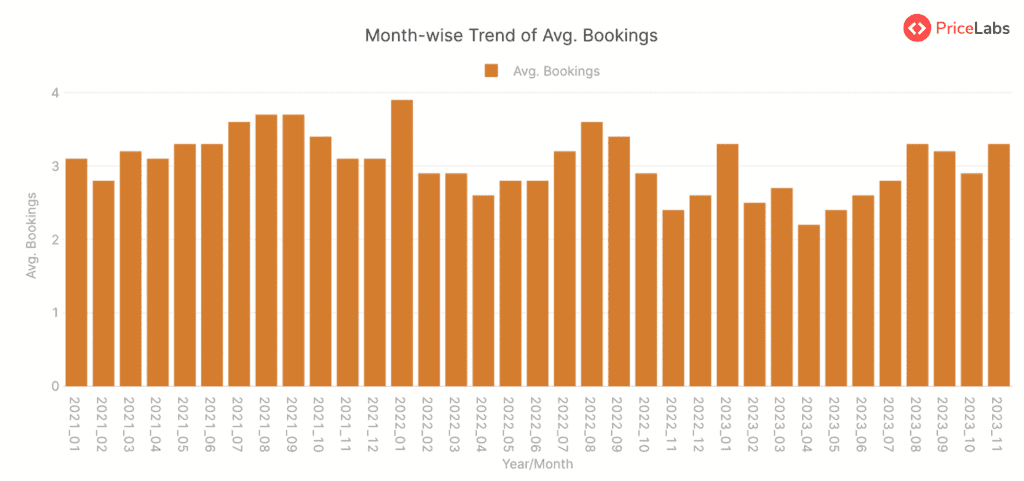
The average bookings in Vermont, United States, show some variation and potential seasonal trends over the years from 2021 to 2023. Starting from January 2021, with an average of 3.1 bookings, there was a general oscillation without a clear upward or downward trend for the rest of the year. The highest average bookings in 2021 were seen in August and September at 3.7, followed by a slight drop with an average between 3.1 and 3.4 per month for the rest of the year.
2022 started with a high average bookings figure of 3.9 in January, after which it dropped to 2.9 in February and remained below 3 until July when it again rose to 3.2. The highest average booking for the year was seen in August, at 3.6. This figure decreased again towards the end of the year, reaching a low of 2.4 in November.
In 2023, average bookings started increasing again from 3.3 in January, peaking at 3.3 in August. The rest of the year shows average bookings oscillating between 2.2 and 3.3. A potential seasonal trend can be observed around the summer months, as there tends to be a peak in average bookings from July to August each year. This could indicate higher demand for accommodations during the summer holidays or due to favorable weather conditions for travel. However, these trends might also just showcase random variation inherent in the nature of such data.
Count of Active Listings Summary

The count of active listings in Vermont, United States, has shown an overall increasing trend over the past years as per the provided data. In January 2021, there were 7608 active listings, and by November 2023, this number had risen to 12,085. The increase wasn’t always steady, as there were a few fluctuations from month to month. However, the general trend has indeed been towards growth. For instance, the active listings crossed the 10,000 mark in June 2022, and since then, it has largely remained above that figure. The overall increase in active listings suggests a potentially growing market or increased participation from sellers across the given timeframe until November 2023.
Get actionable market insights from PriceLabs’ Market Dashboards.
About Short-term Rental Index
The World STR (Short-term Rental) Index by PriceLabs is a free tool for tracking short-term rental market performance worldwide. It offers data from Airbnb markets worldwide, refreshed monthly. You can access free insights on which locations are gaining or losing popularity. Key features include:
- Compare: Compare year-over-year metrics like active listings, occupancy rates, RevPAR, and ADR.
- Trend: Visualize how metrics have changed over the past years.
- Pacing: Compare upcoming year metrics to the previous year for occupancy, ADR, and RevPAR.
Explore more FREE tools by PriceLabs here.
About PriceLabs
PriceLabs is a revenue management solution for the short-term rental and hospitality industry, founded in 2014 and headquartered in Chicago, IL. Our platform helps individual hosts and hospitality professionals optimize their pricing and revenue management, adapting to changing market trends and occupancy levels.
With dynamic pricing, automation rules, and customizations, we manage pricing and minimum-stay restrictions for any portfolio size, with prices automatically uploaded to preferred channels such as Airbnb, Vrbo, and 100+ property management systems and channel integrations.
Every day, we price over 300,000+ listings globally across 135+ countries, offering world-class tools like the Base Price Help and Minimum Stay Recommendation Engine. Choose PriceLabs to increase revenue and streamline pricing and revenue management. Sign up for a free trial at pricelabs.co today.