
Table of Contents
Updated : Mar 24, 2026
The Canary Islands short-term rental market has completed one of its strongest performance cycles on record. After the COVID crash of 2020, this Atlantic archipelago has not just recovered—it has repriced upward, grown its supply base by over 38%, and is now entering 2026 with forward bookings tracking ahead of last year on ADR. As Canary Island STR market trends shift toward high-yield maturation, the question for hosts and investors is no longer “when does the recovery end?” but “how do you capture the pricing cycle now underway?”
The Listing Boom Has Plateaued — and That’s Good News
Active listings in the Canary Islands surged from around 35,900 in 2021 to a peak of 49,400 in 2024 — a 38% increase in just three years. That kind of supply growth would typically put downward pressure on occupancy. But here’s the interesting part: 2025 has seen the first meaningful pullback, with average active listings settling at approximately 48,200, a modest 2.5% decline from the 2024 peak.
This is a classic supply maturation signal. The rapid expansion wave appears to be moderating, which means the market may be entering a phase where existing operators — particularly those who invest in dynamic pricing and guest experience — stand to benefit most.
A flattening supply curve alongside rising ADR is one of the healthiest dynamics an STR market can show. It suggests operators are becoming more selective — and that the market isn’t simply absorbing price gains by flooding with new listings.
Resilient Demand: Key Canary Island STR Market Trends Across All Seasons
Occupancy across the Canary Islands is holding steady — and improving in key shoulder months. The 2025–26 season is tracking ahead of 2024–25 in April (+4.6 pts), June (+2.5 pts), July (+4.1 pts), August (+4.3 pts), September (+3.3 pts), and October (+2.9 pts). Only the winter months — historically already very strong — show minor softening.
The average annual occupancy for 2024–25 was 70.5%, rising to an estimated 71.9% for 2025–26, an absolute gain of nearly 1.4 percentage points. In a market with 48,000+ listings, that translates to a meaningfully higher volume of booked nights across the inventory.
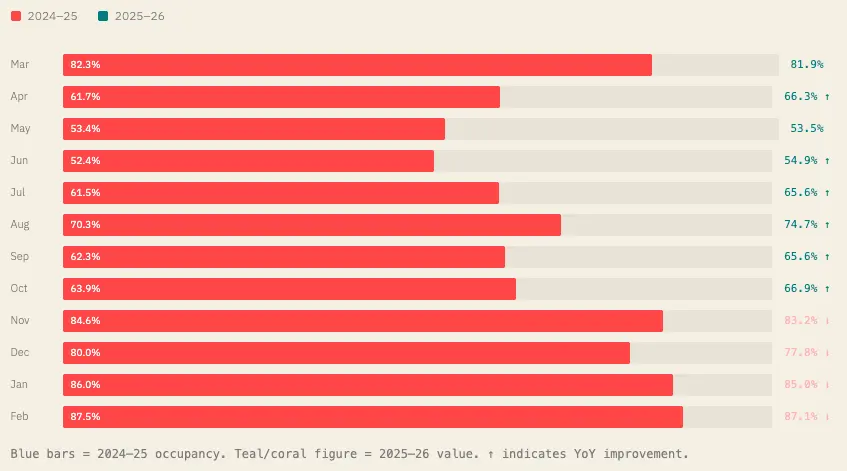
What’s particularly notable is where the gains are coming from: the shoulder and mid-demand months (April through October) are strengthening. This signals that the Canary Islands is developing a more diversified year-round demand base — a shift that gives hosts greater flexibility in pricing strategy and reduces dependence on the winter peak alone.
ADR Growth Is the Real Story — Up 17% Year-on-Year
If occupancy is the headline, ADR is the story. The average daily rate for the 2025–26 season (Mar–Feb) has risen to $117.50 USD / €101.80 EUR on average — compared to $100.07 / €93.25 in 2024–25. That’s a 17.5% increase in USD terms and a 9.1% increase in EUR terms (reflecting USD/EUR exchange dynamics).
Strong pricing is holding across the calendar: every single month of the 2025–26 season has delivered higher ADR than the prior year, with December, January, and February recording the sharpest gains — all above $138–142 USD per night.
| MONTH | ADR 2024–25 (USD) | ADR 2025–26 (USD) | YOY CHANGE | ADR 2025–26 (EUR) |
| Mar | $97.47 | $105.82 | +8.6% | €97.93 |
| Apr | $93.41 | $104.00 | +11.3% | €92.69 |
| May | $88.34 | $98.14 | +11.1% | €87.02 |
| Jun | $89.18 | $100.99 | +13.2% | €87.56 |
| Jul | $96.72 | $111.71 | +15.5% | €95.59 |
| Aug | $100.97 | $118.18 | +17.0% | €101.37 |
| Sep | $93.58 | $110.86 | +18.5% | €94.47 |
| Oct | $114.40 | $117.16 | +2.4% | €100.61 |
| Nov | $100.65 | $123.50 | +22.7% | €106.78 |
| Dec | $111.10 | $141.96 | +27.8% | €121.16 |
| Jan | $108.80 | $139.22 | +28.0% | €118.63 |
| Feb | $106.22 | $138.84 | +30.7% | €117.39 |
| Average | $100.07 | $117.53 | +17.5% | €101.77 |
RevPAR — the combined metric that accounts for both occupancy and rate — has moved even more decisively. The average RevPAR for 2025–26 is tracking at $85.73 USD / €74.19 EUR, versus $71.17 / €66.48 in 2024–25. That’s a 20.4% RevPAR improvement — the compound effect of both higher rates and stronger fill.
A 20% RevPAR improvement in a market with 48,000 active listings represents a structural repricing of the Canary Islands STR opportunity — not just a good quarter.
2026–27 Is Already Booking at Premium Rates
Forward pacing data is one of the most actionable signals an STR host or investor can track. And right now, it’s sending a clear message: guests booking into 2026–27 are paying significantly more than same-time-last-year bookings for 2025–26.
The 2026–27 ADR pacing is averaging $131 USD / €113 EUR across the forward period — compared to $101 / €89 for 2025–26 STLY. That’s roughly a 25–29% premium on early bookings for the upcoming season.
Importantly, the occupancy pacing for 2026–27 is still early — with much of the inventory yet to be filled. March 2026 is already at 65.2% pacing occupancy (vs 70.0% STLY), and summer months are beginning to accumulate bookings with Aug 2026 already showing 21.2% pacing. This is typical of how forward pacing builds: rates lock in early at premium, and fill accelerates as the date approaches.
| MONTH | 2025–26 FINAL ADR | 2025–26 STLY ADR | 2026–27 PACING ADR | PACING VS STLY |
| Mar 26 | $105.82 | $105.54 | $132.40 | +25.4% |
| Apr 26 | $104.00 | $107.49 | $130.00 | +20.9% |
| May 26 | $98.14 | $103.46 | $127.69 | +23.4% |
| Jun 26 | $100.99 | $108.97 | $135.42 | +24.3% |
| Jul 26 | $111.71 | $119.34 | $145.81 | +22.2% |
| Aug 26 | $118.18 | $124.71 | $149.05 | +19.5% |
| Sep 26 | $110.86 | $118.44 | $141.55 | +19.5% |
| Oct 26 | $117.16 | $128.24 | $158.42 | +23.5% |
| Jan 27 | $139.22 | $125.73 | $162.24 | +29.0% |
| Feb 27 | $138.84 | $125.75 | $175.05 | +39.2% |
What This Means for Hosts:
Early bookers are locking in at rates 20–39% above what same-period bookings looked like a year ago. If you’re not yet using a dynamic pricing tool that captures this forward demand signal and adjusts your rates accordingly, you are likely leaving meaningful revenue on the table during the highest-value booking windows.
Guests Are Booking Earlier and Staying Longer
Two behavioral metrics give operators real strategic advantages when understood correctly: Median Booking Window (how far in advance guests book) and Median Length of Stay (how long they stay).
Booking Window
The median booking window has increased from 48.4 days in 2024–25 to 51.0 days in 2025–26 — a 5.3% increase. This may sound modest, but it’s operationally significant: guests are committing earlier, which means rate decisions made 6–8 weeks out have greater revenue impact than ever. Winter months show the most advanced booking windows, with January bookings coming in 69 days out on average.
Length of Stay
The median length of stay has held remarkably stable at 7.2 days in 2025–26, fractionally down from 7.5 in 2024–25. This tells us the Canary Islands continues to attract the week-plus traveler — consistent with its positioning as a flight destination for European travelers seeking a full holiday break rather than a quick city trip. This is strategically positive: longer stays reduce turnover costs, housekeeping frequency, and vacancy gaps between reservations.
Most Hosts Still Aren’t Capturing the Full Opportunity
The DP (Dynamic Pricing) segmentation data from August 2025 paints a striking picture of where the market stands in terms of pricing sophistication. Among the ~1,823 active listings in the sample:
| PRICING TYPE | # LISTINGS | % OF MARKET | AUG OCCUPANCY |
| No dynamic pricing (None) | 600 | 33.9% | 85.7% |
| Low dynamic pricing | 560 | 31.6% | 87.9% |
| Moderate dynamic pricing | 314 | 17.7% | 91.3% |
| Null / Unknown | 296 | 16.7% | 79.2% |
| High dynamic pricing | 53 | 3.0% | 89.8% |
Only 3% of listings are using high-intensity dynamic pricing — yet moderate adopters are achieving 91.3% occupancy in August, outperforming all other segments. The combination of strong pricing tools and a market with genuine pricing power (as evidenced by the ADR trends above) creates a meaningful performance gap between the optimized and the un-optimized.
In a market where ADR is growing 17–30% year-on-year and guests are booking 51 days in advance, a static pricing calendar is a revenue leak. The data shows the gap: moderate dynamic pricing adoption is generating the highest occupancy in the segment.
Bridging the Gap: How PriceLabs Captures Canary Island STR Market Trends
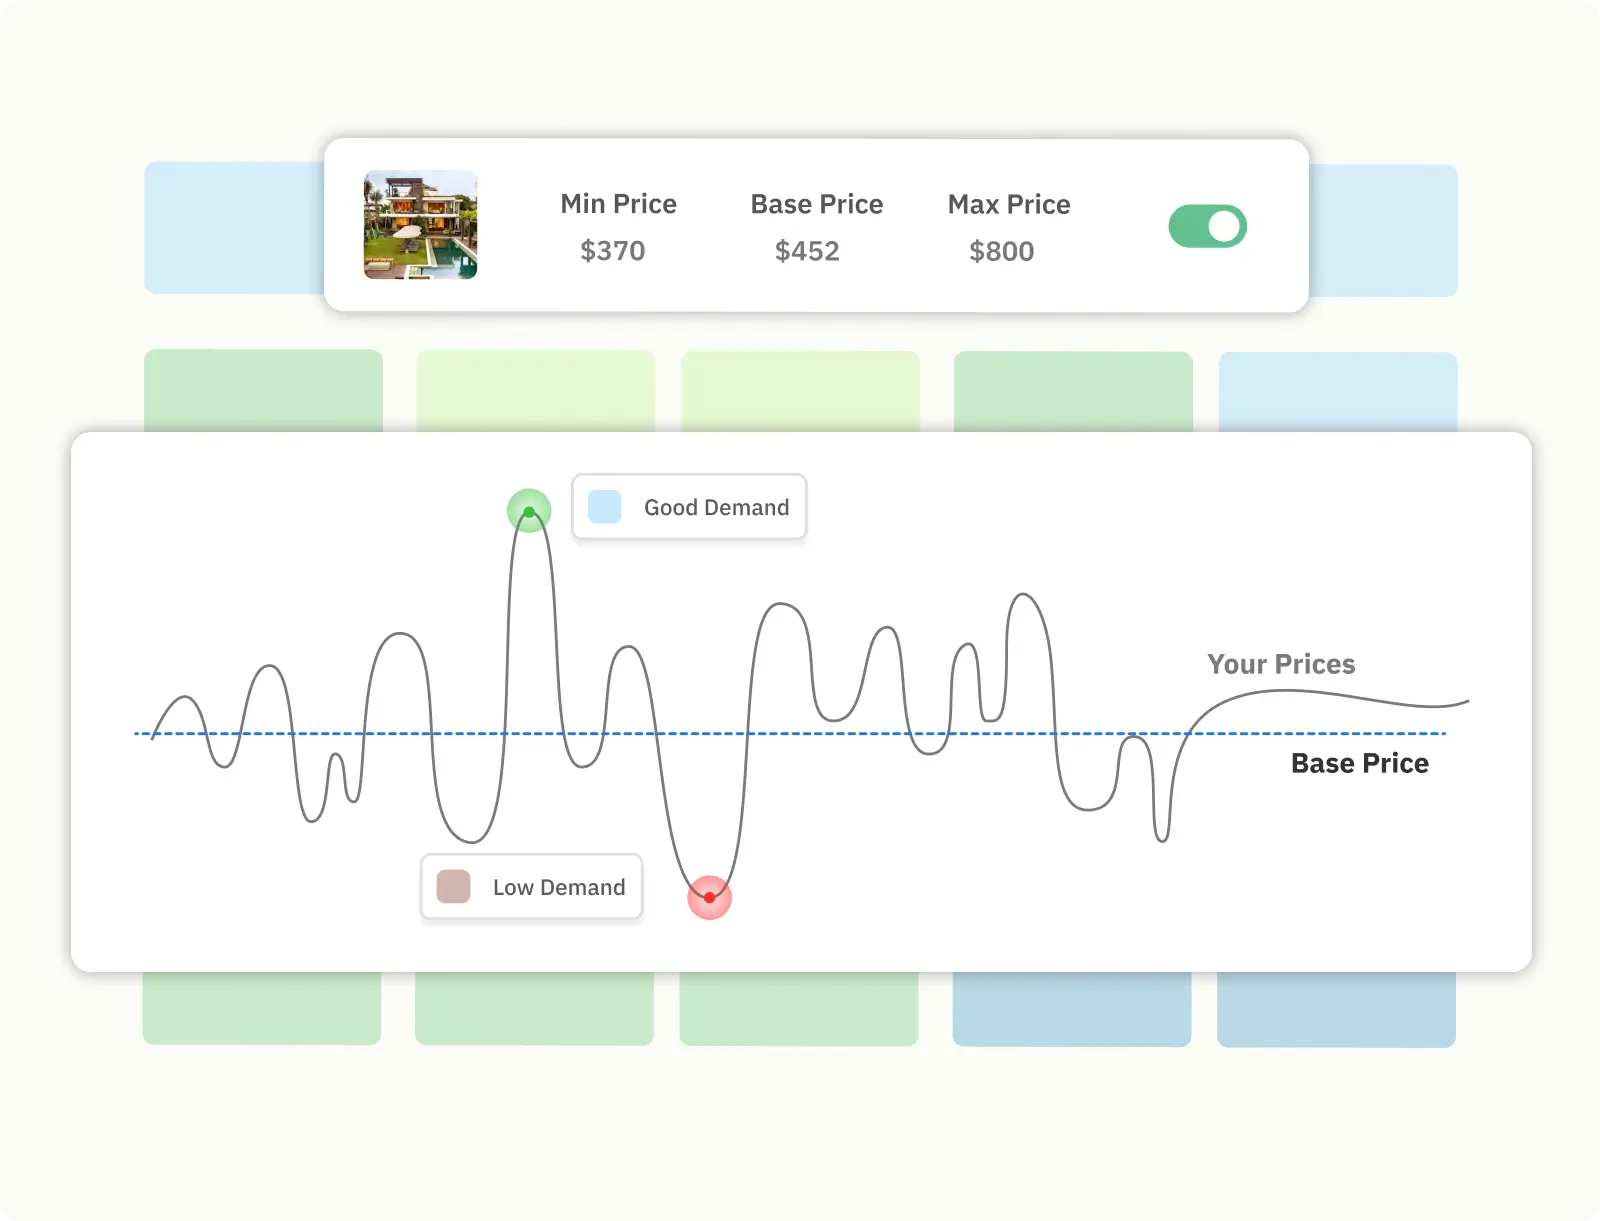
The data is clear: in a market that is repricing as rapidly as the Canary Islands, manual pricing is no longer a viable strategy—it’s a revenue leak. PriceLabs Dynamic Pricing allows hosts and investors to automate their revenue management by syncing directly with the real-time shifts in the archipelago’s inventory and demand.
Here is how PriceLabs helps you stay ahead of the Canary Island STR market trends mentioned above:
- Hyper-Local Hyper-Growth: While the general market ADR is up 17.5%, performance varies by island and even by street. PriceLabs uses hyper-local data to ensure your property isn’t just following a trend, but leading its specific neighborhood.
- Capturing the 2027 Premium: With early bookers already paying 22–39% more for 2026 and 2027, PriceLabs’ Market Dashboards identify these forward-pacing signals months in advance. The system automatically adjusts your rates upward for far-out dates, ensuring you don’t “sell out” too cheap to early bird travelers.
- Optimizing the 51-Day Window: Since the median booking window has grown to 51 days, PriceLabs uses customizations to help you manage “far-out” premiums and “last-minute” discounts intelligently. It protects your ADR during the peak booking window while filling gaps as the stay date approaches.
- Shoulder Season Maximization: As April through October strengthen, PriceLabs identifies these emerging demand pockets. Instead of relying on a static “summer” or “winter” rate, the algorithm detects spikes in occupancy and raises your rates in real-time to match the new year-round demand.
By moving from a static calendar to a data-driven approach, hosts can shift from the “un-optimized” segment into the high-occupancy bracket (91%+) that modern Canary Island STR market trends now support.
As these Canary Island STR market trends show, the archipelago has moved into a high-performance phase. With supply stabilizing and ADR hitting record highs, the opportunity for 2026 and 2027 is significant for those using the right data.
6 Key Takeaways for Canary Islands STR Operators
- Supply is peaking: The listing count has pulled back from its 2024 peak. Competition from new supply is easing, which supports sustained rate growth.
- Shoulder seasons are strengthening: April, June, July, August, September, and October all improved YoY in occupancy. Year-round demand is deepening.
- ADR is up 17.5% this season: This is not inflation — it’s genuine pricing power. Guests are willing to pay more, and the data proves it every month.
- RevPAR grew 20% YoY: The compound of higher rates and stronger fill is showing up in the most important revenue metric.
- 2026–27 forward rates are 22–39% higher: Early bookers are already pricing in a premium year. Set your rates accordingly now.
- Dynamic pricing adoption remains low: Only 3% of listings use high DP intensity — meaning the majority of the market is under-capturing the pricing cycle underway.
Data source: PriceLabs STR Index — Canary Islands (Spain) · GeoJSON boundary-based analysis. Last updated March 11, 2026. All figures in USD unless otherwise noted. EUR conversions use monthly average exchange rates.